Century 21 People’s Choice Realty Inc., Brokerage
120 MATHESON BLVD E #103
MISSISSAUGA, Ontario
L4Z 1X1


Toronto, Elms-Old Rexdale, M9W 1V4
$1,447,000$000000
Listed by RE/MAX WEST REALTY INC..
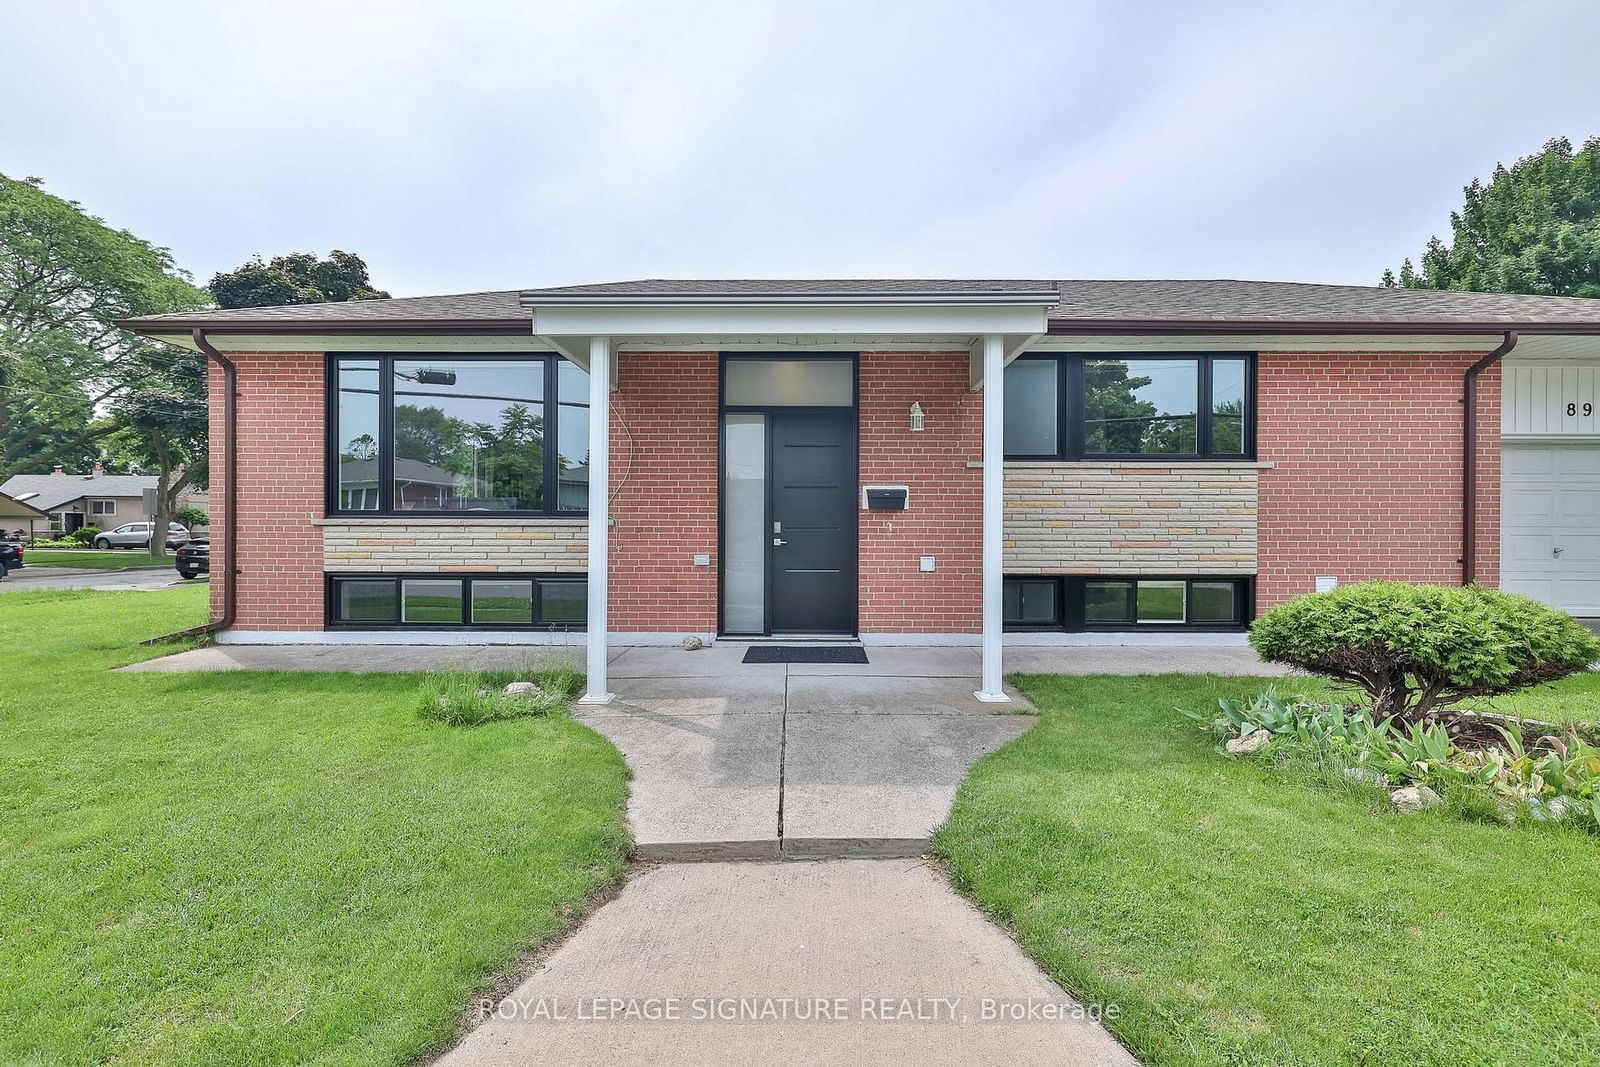
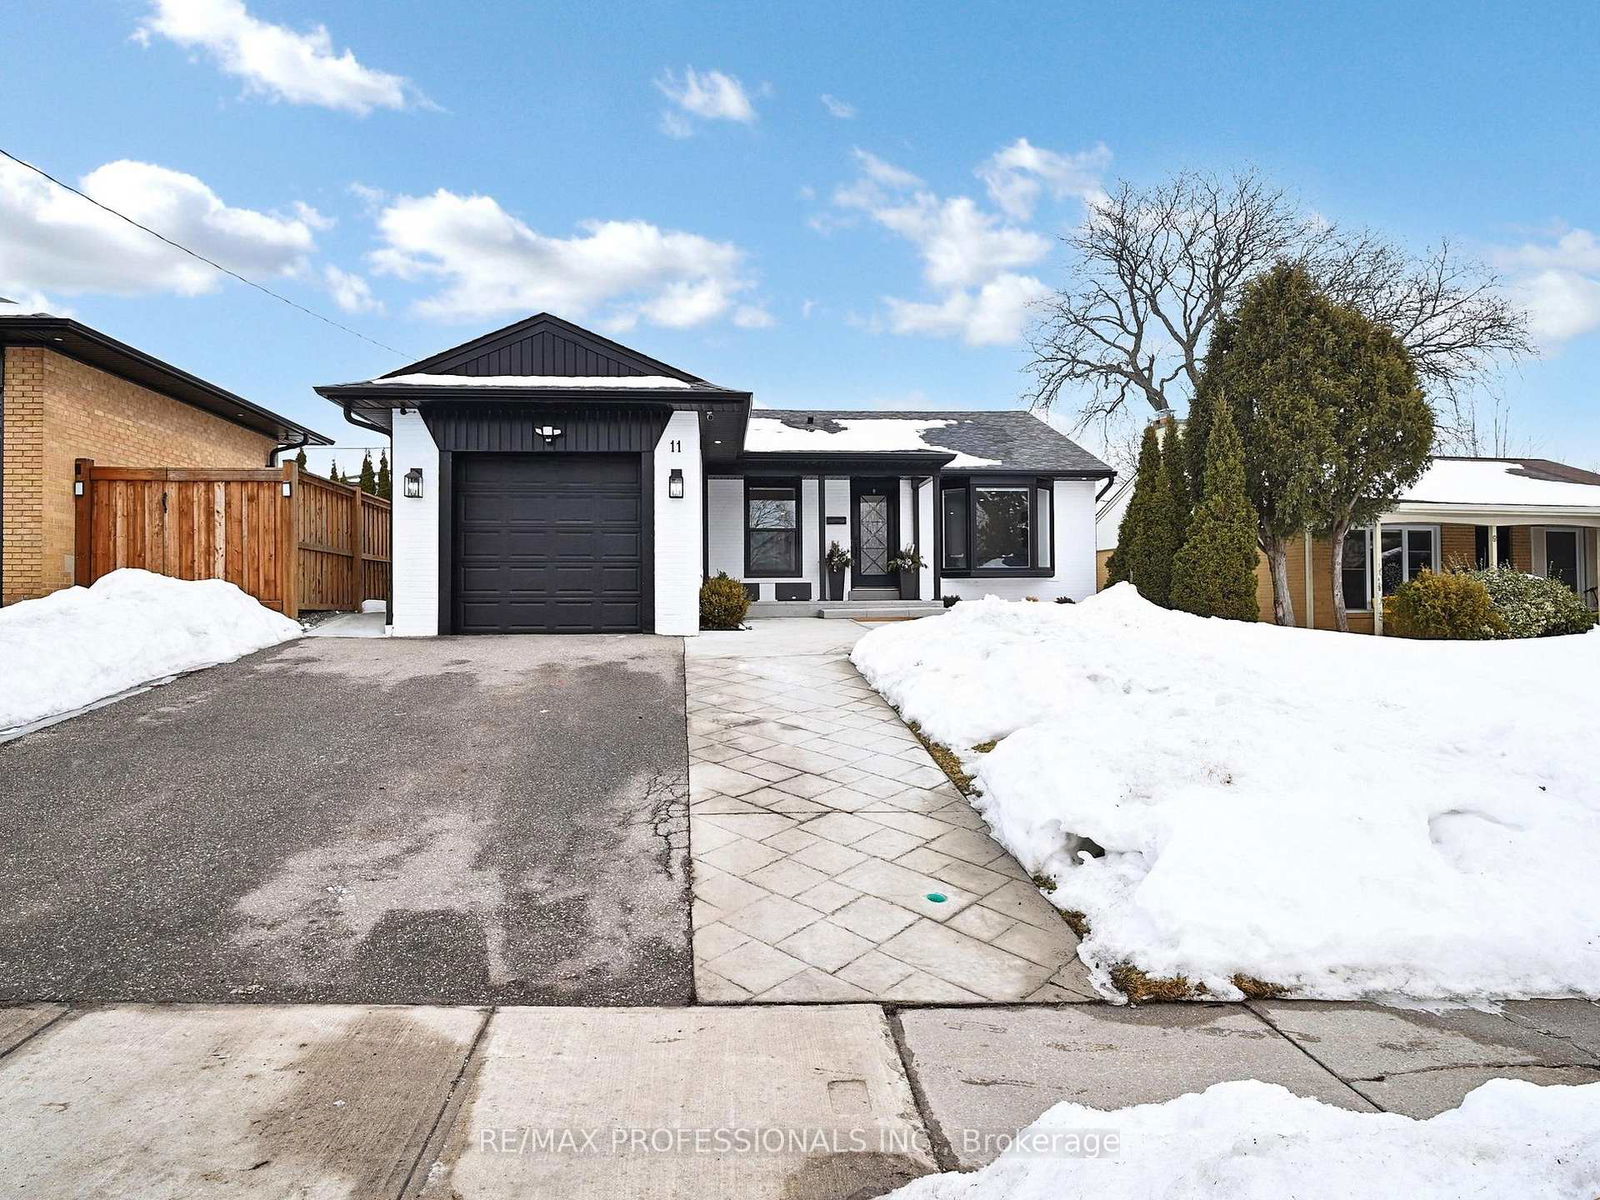
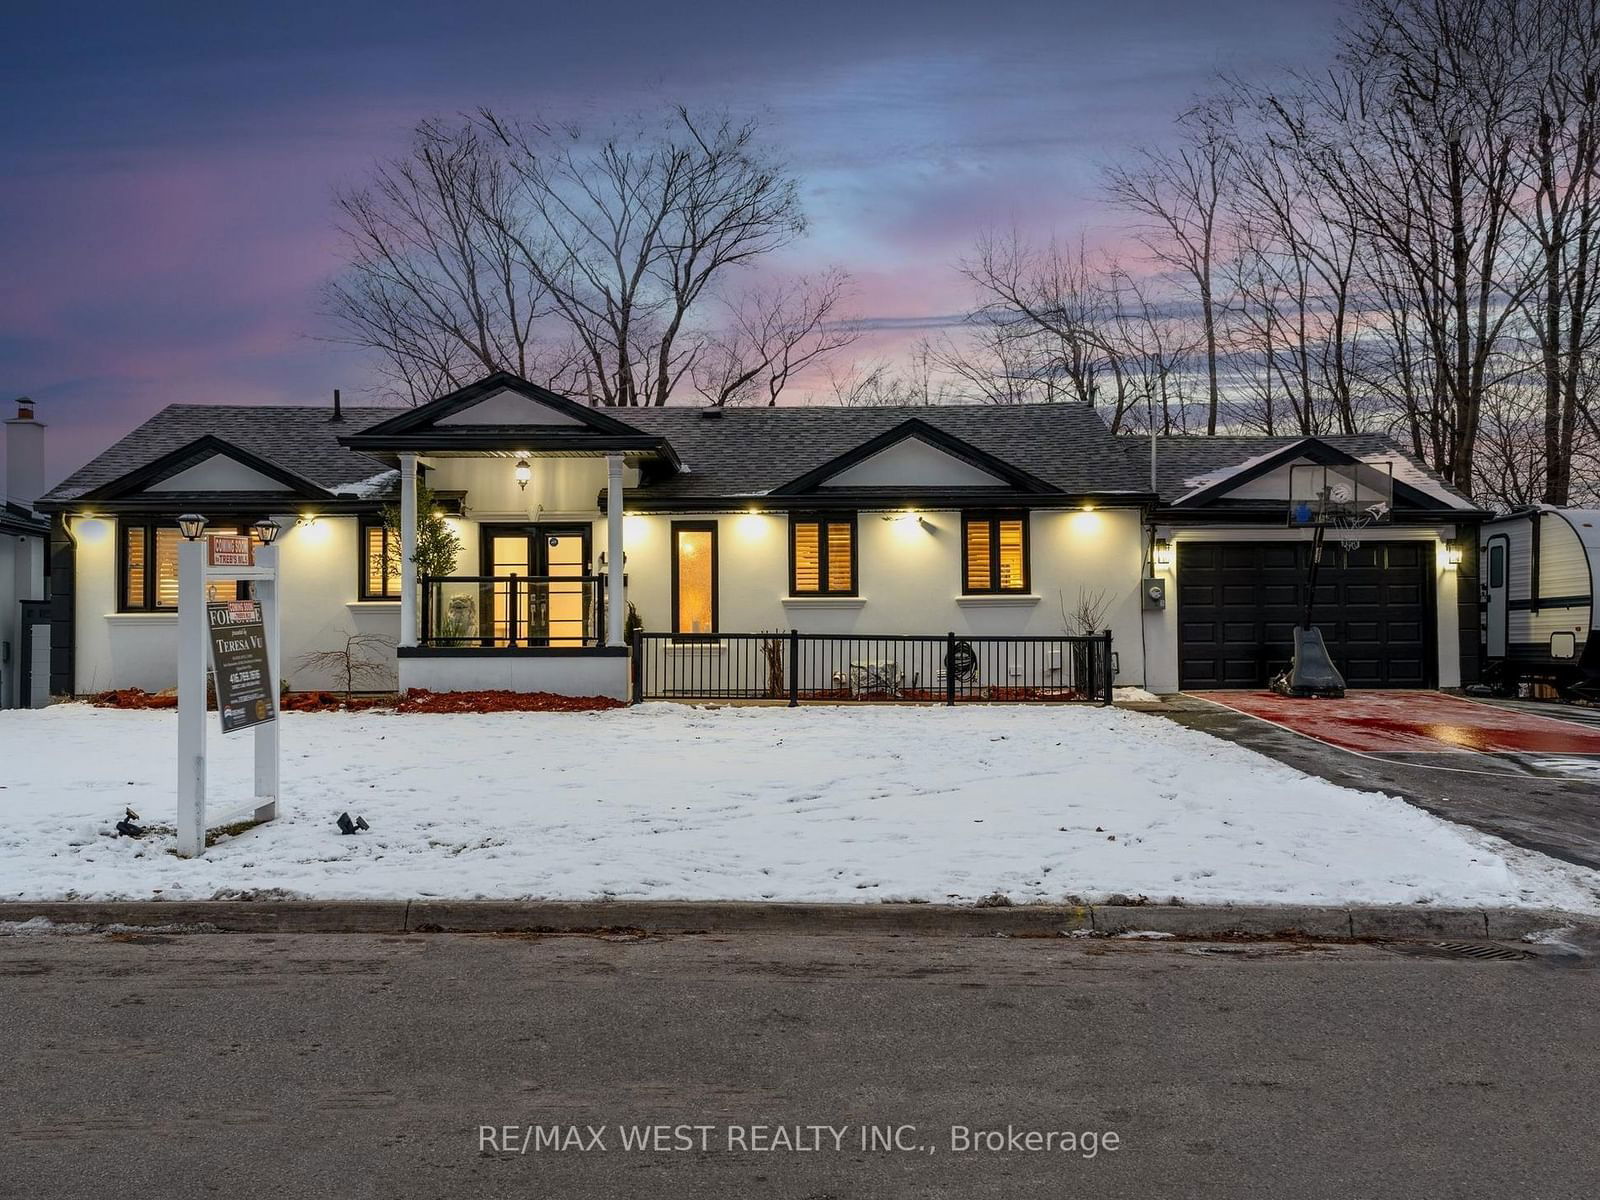
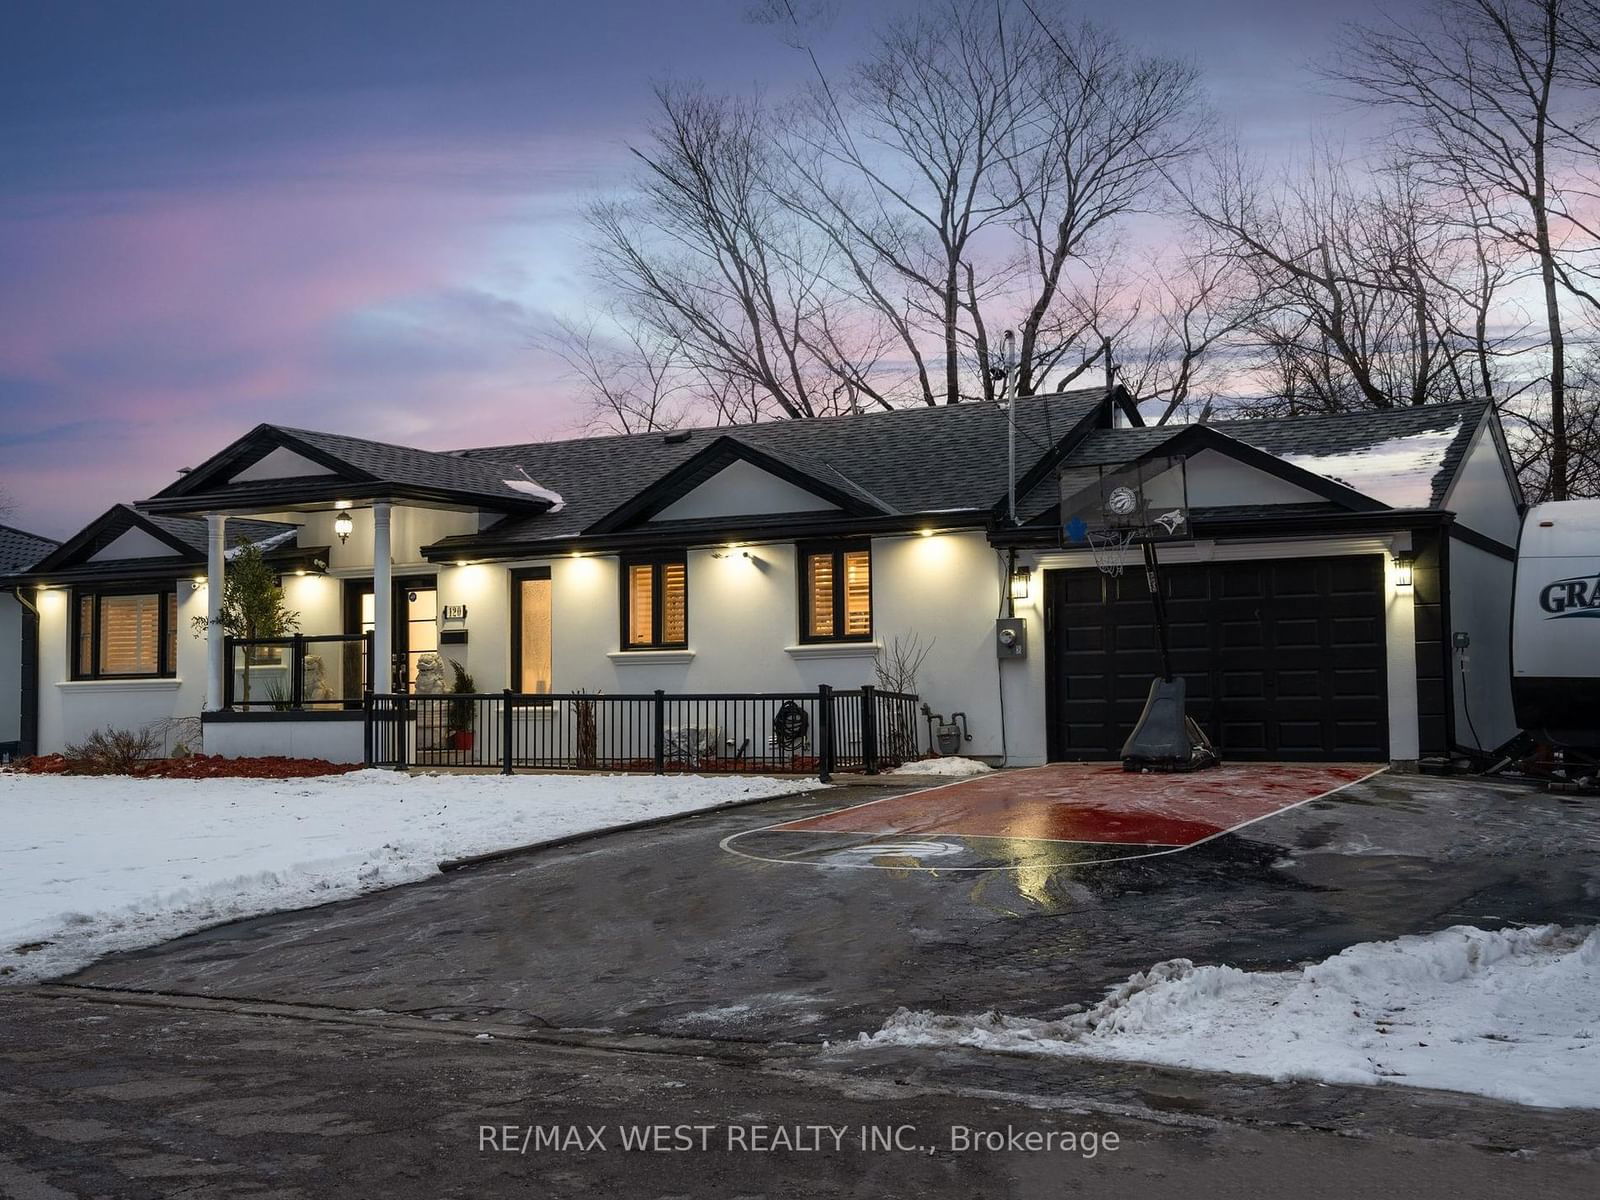
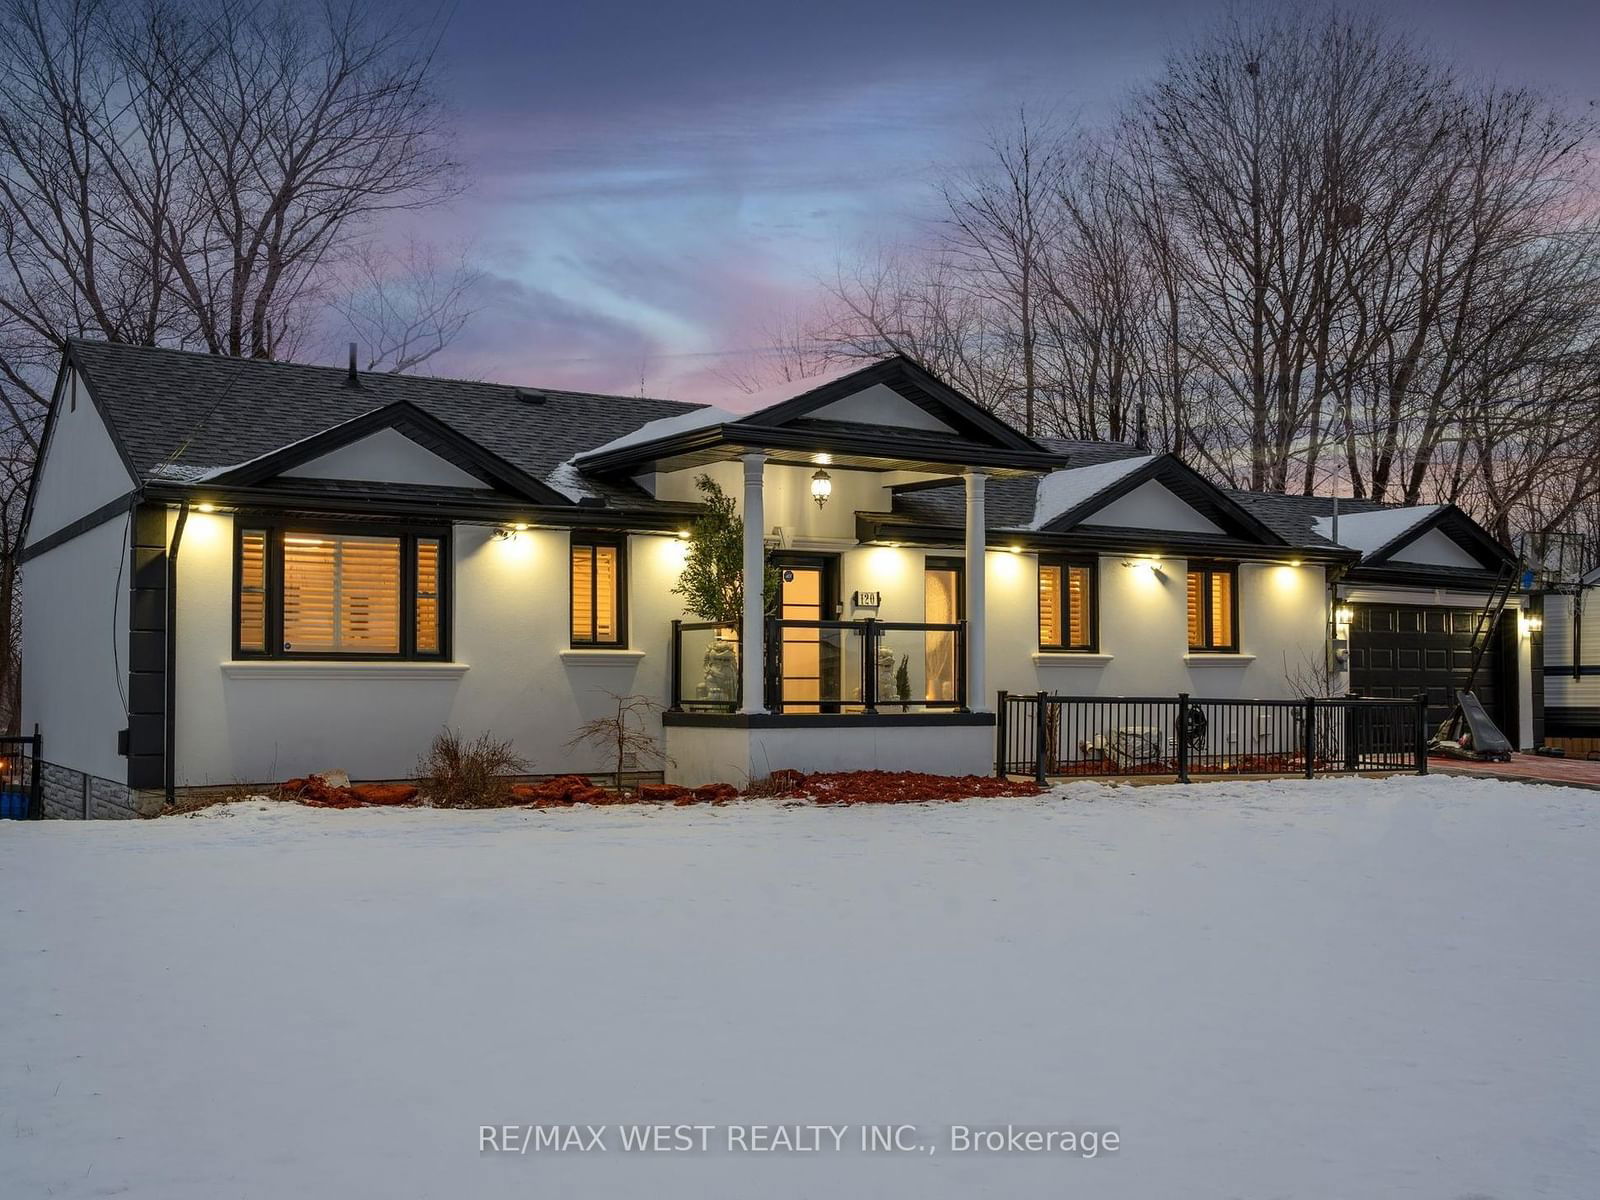
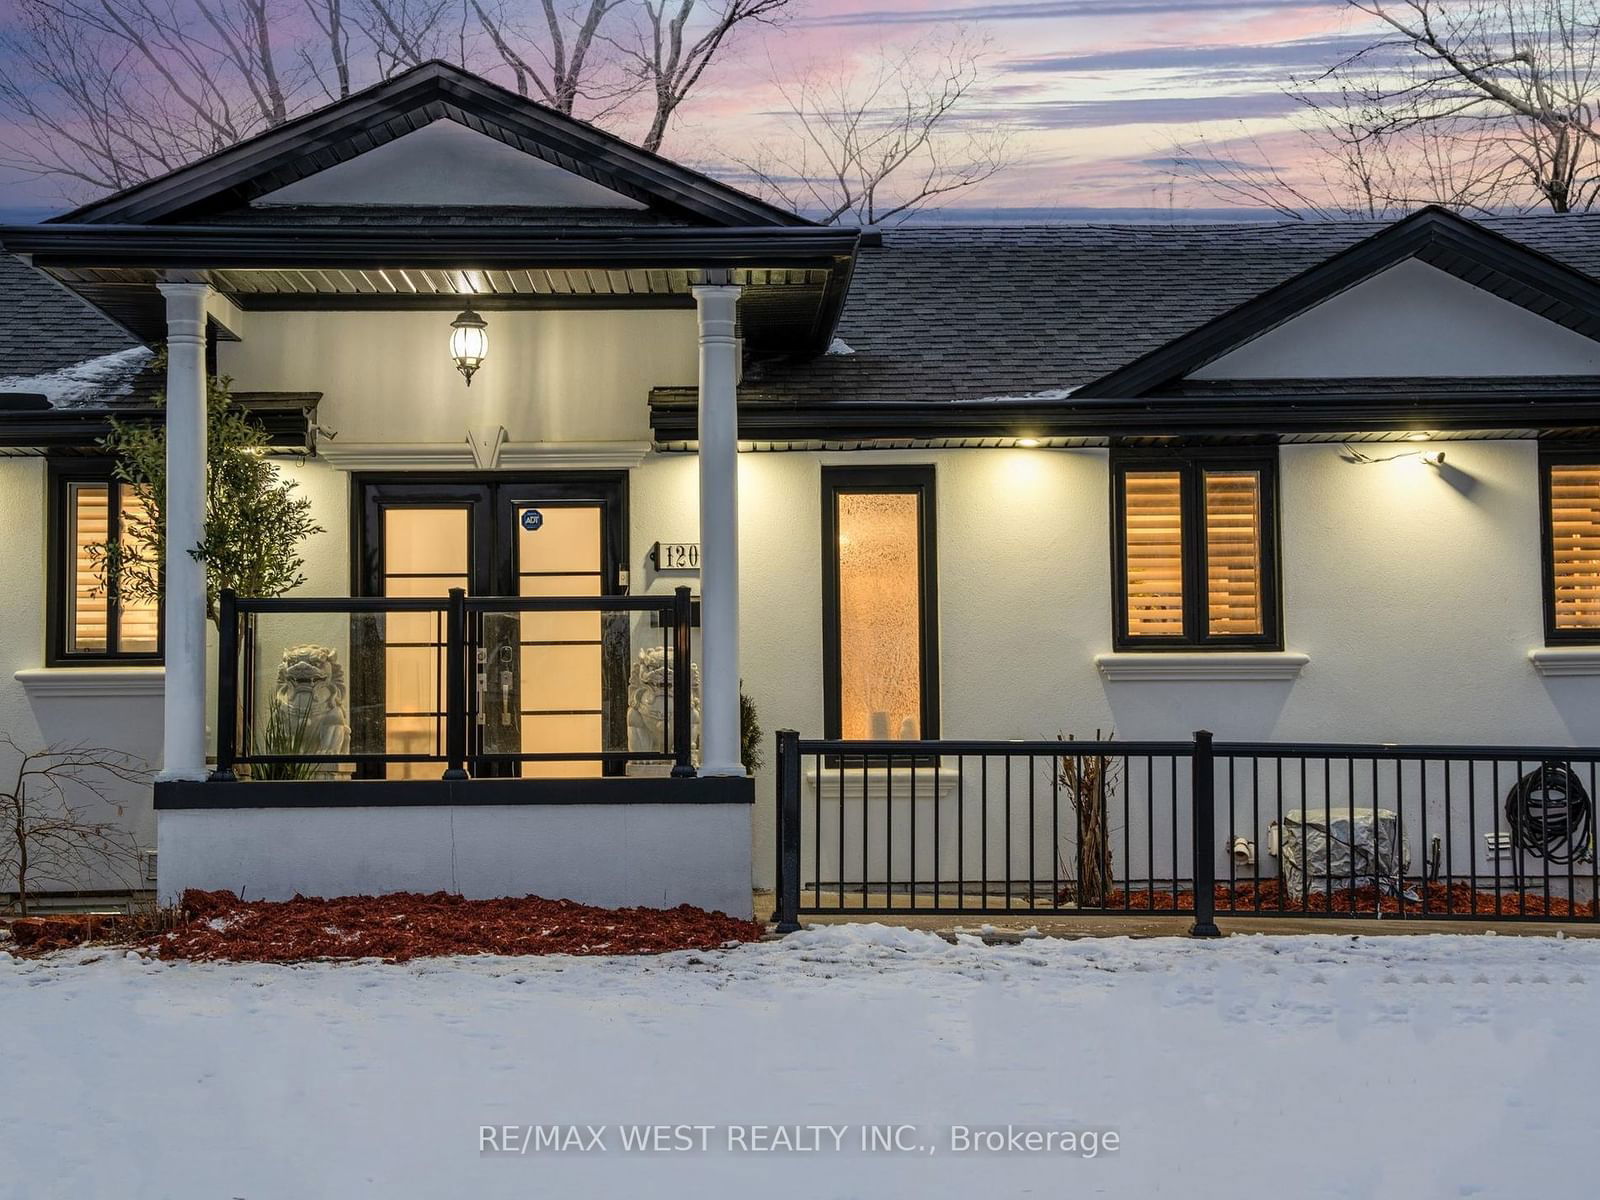
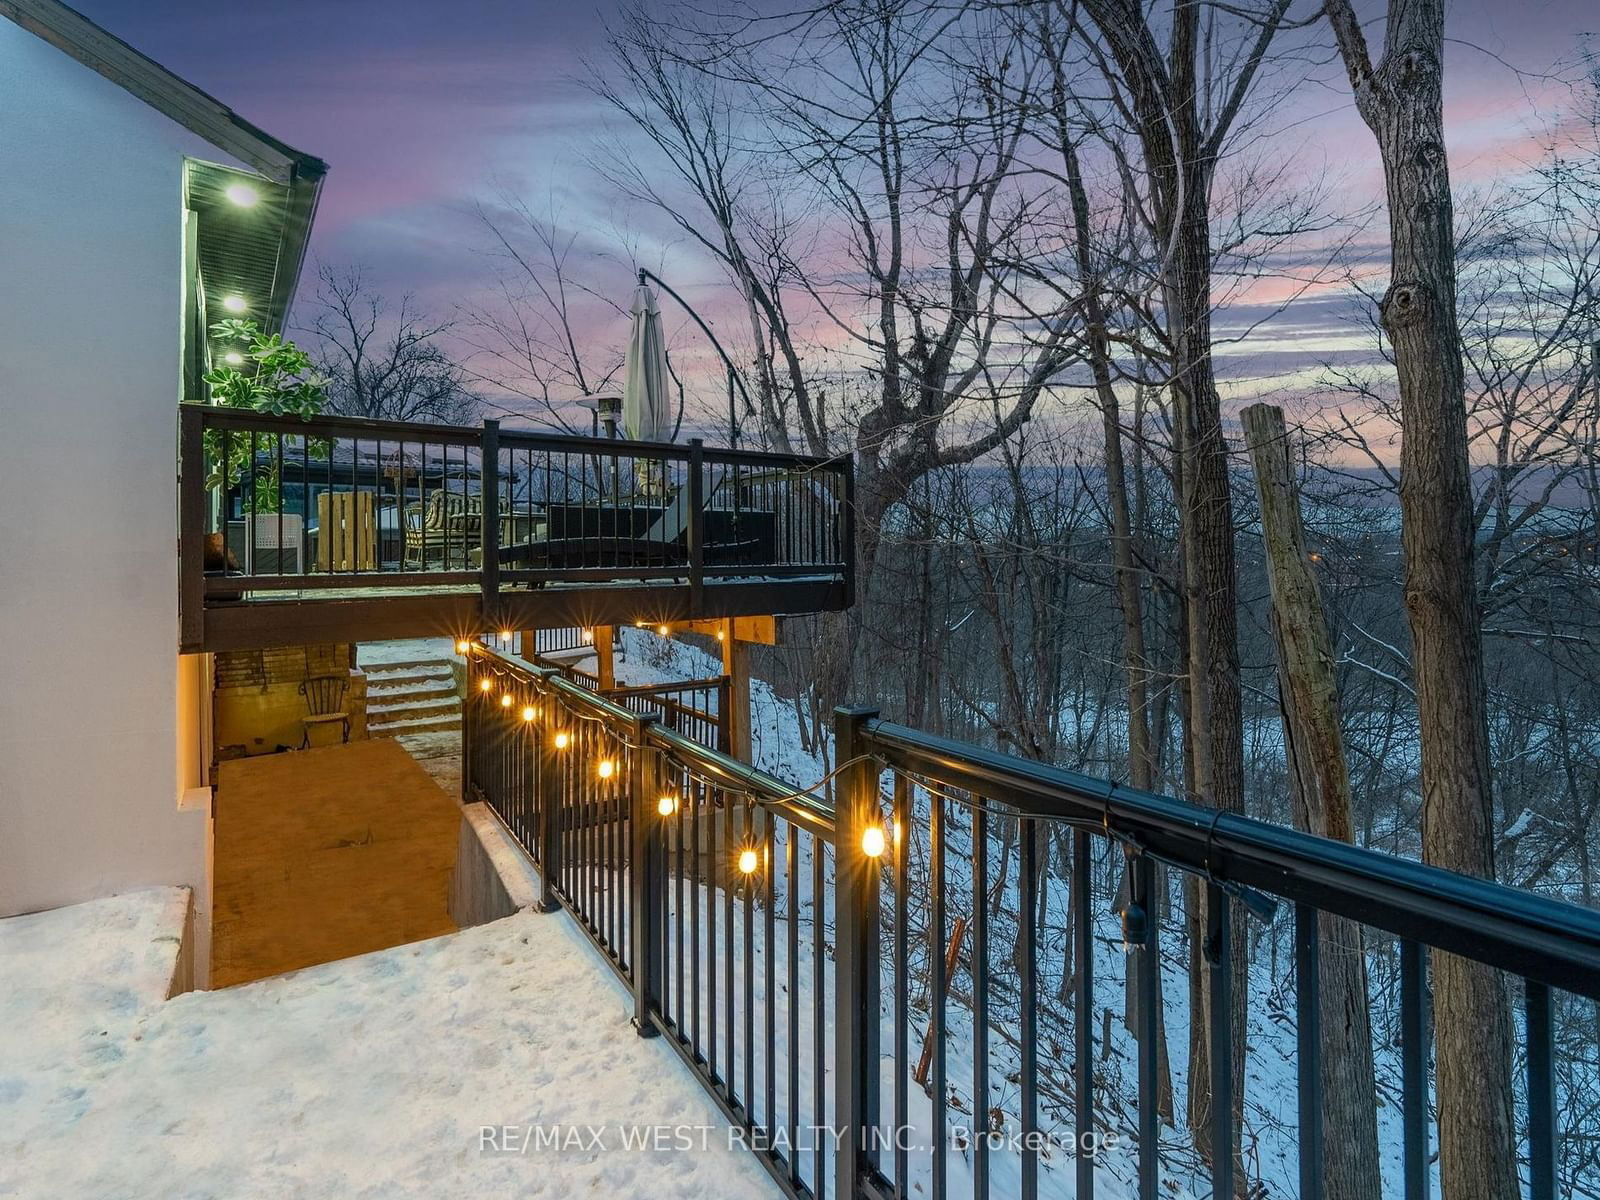
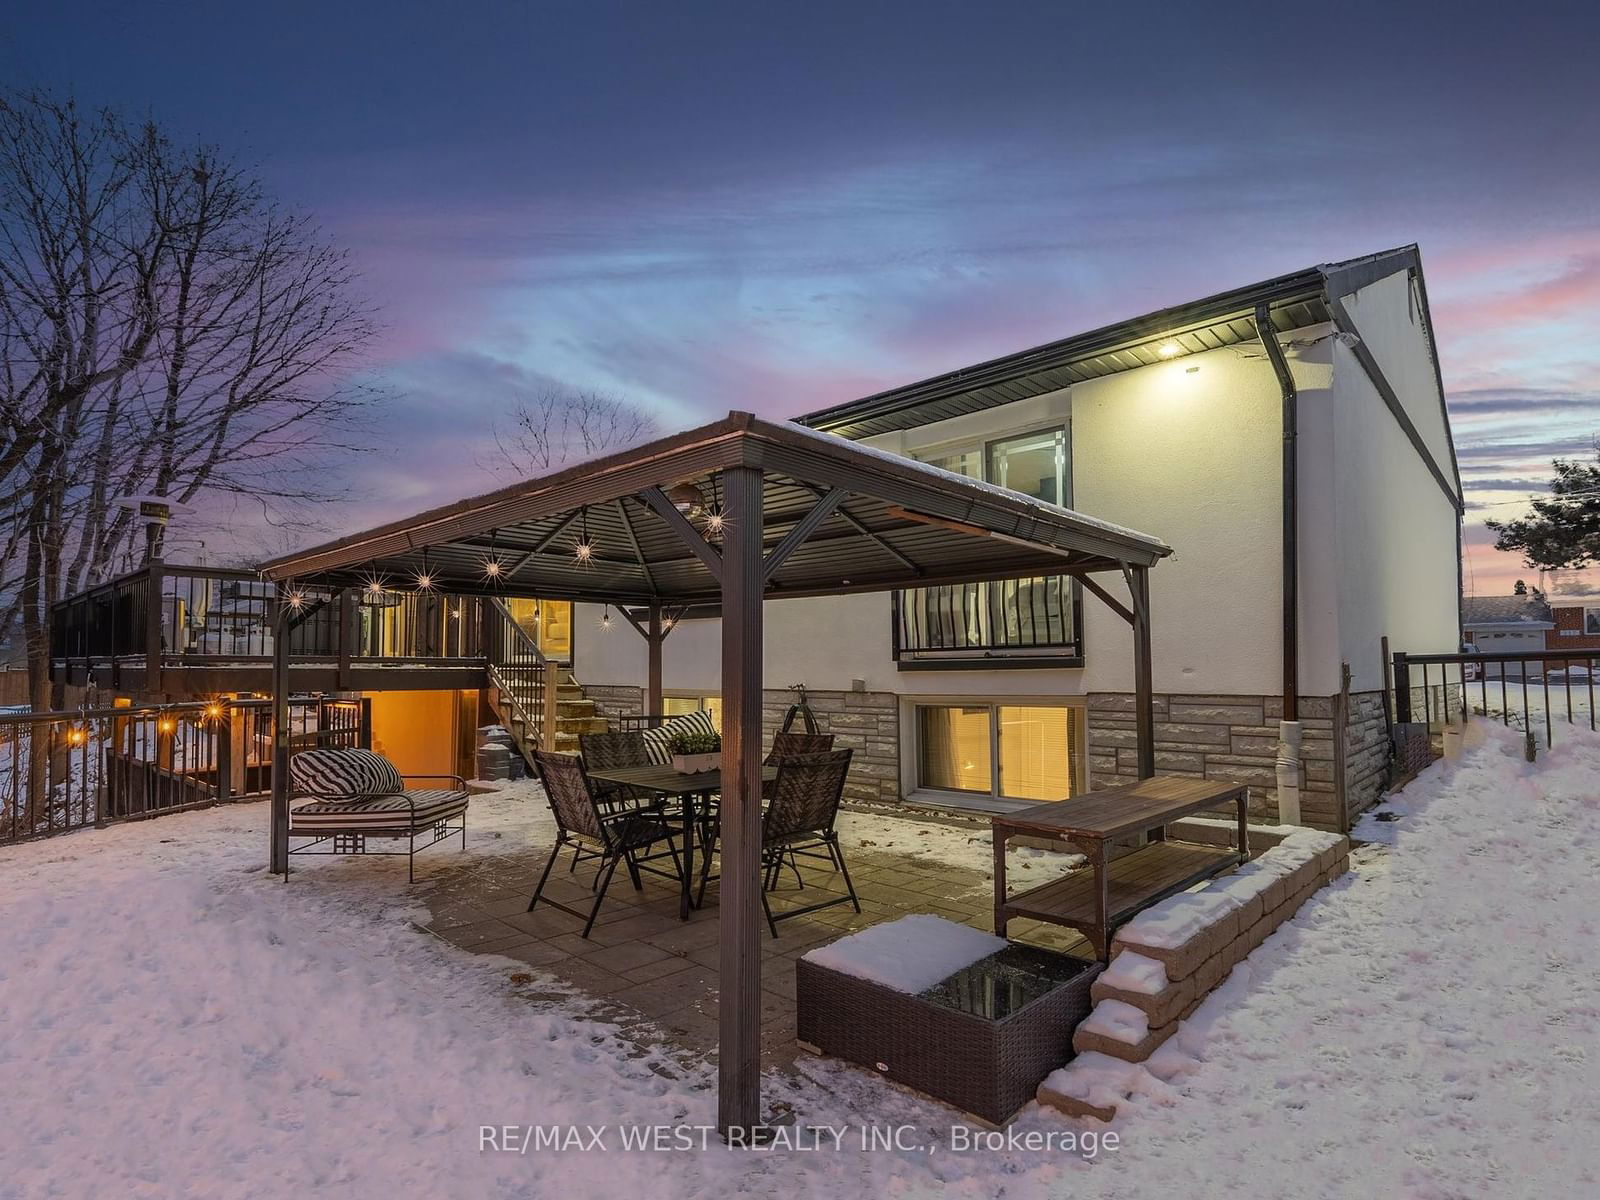
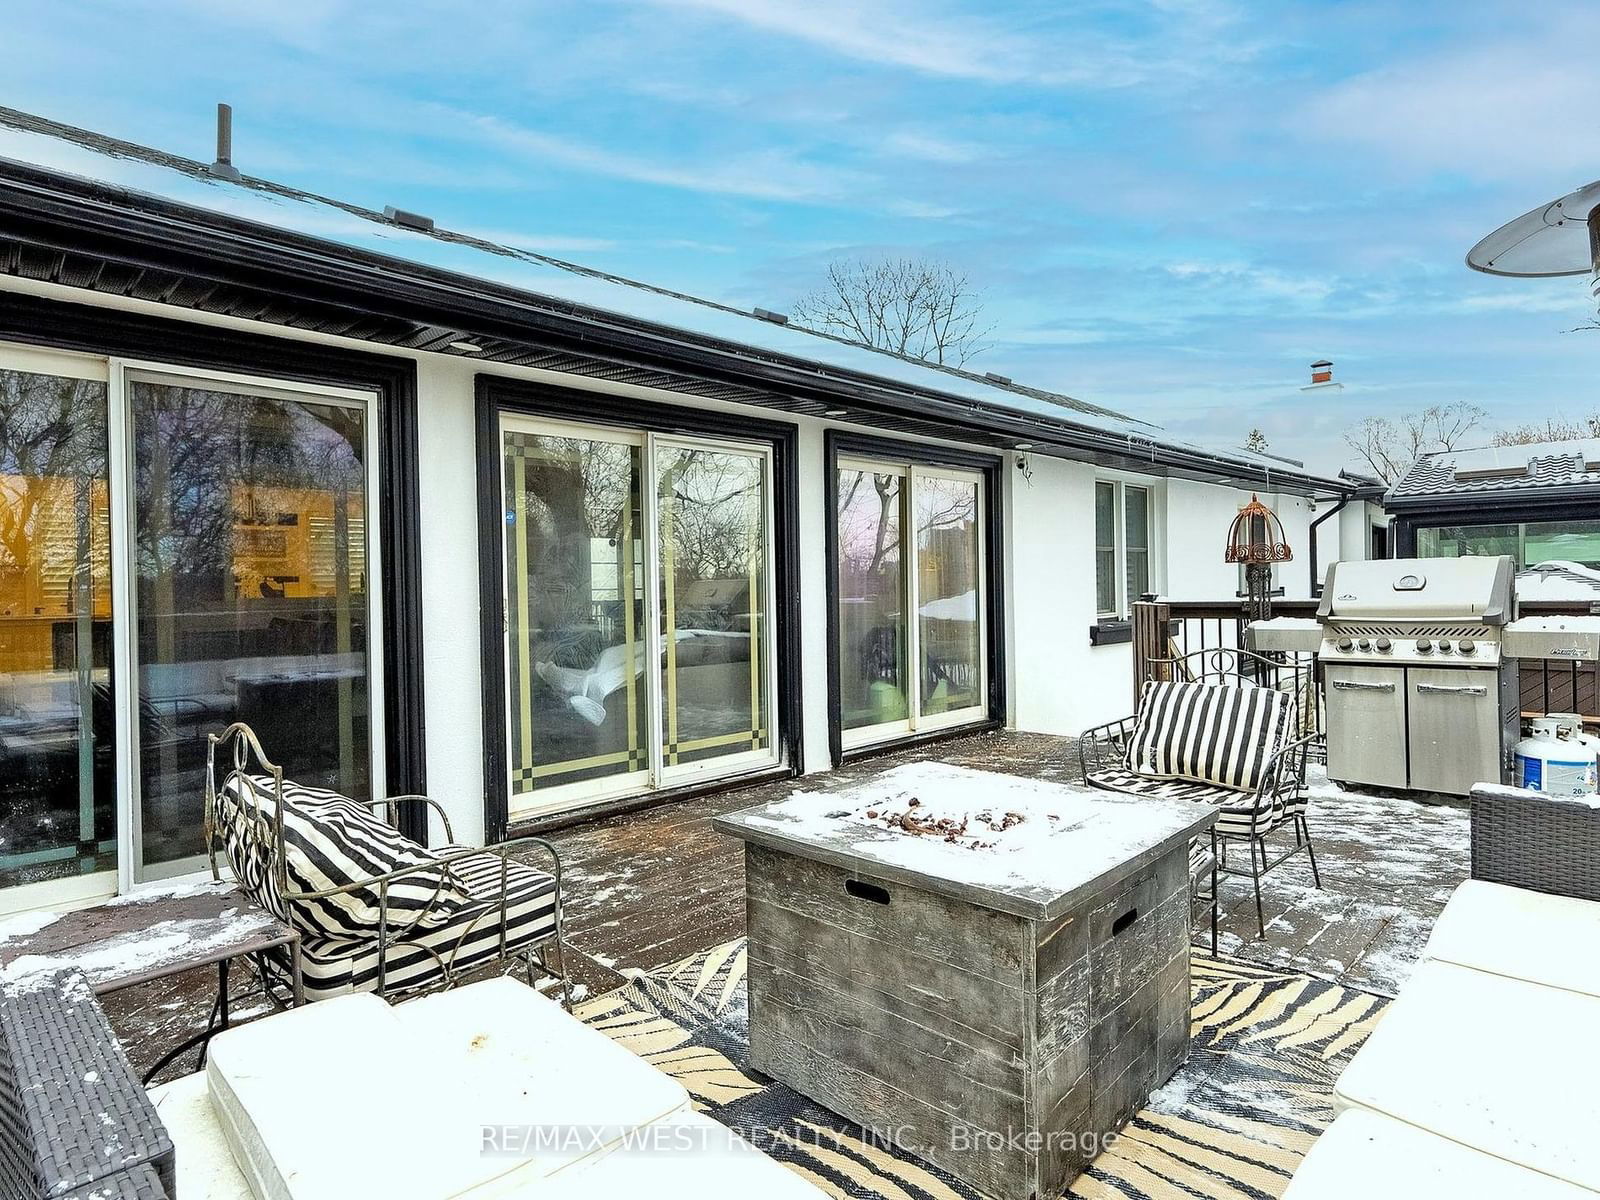
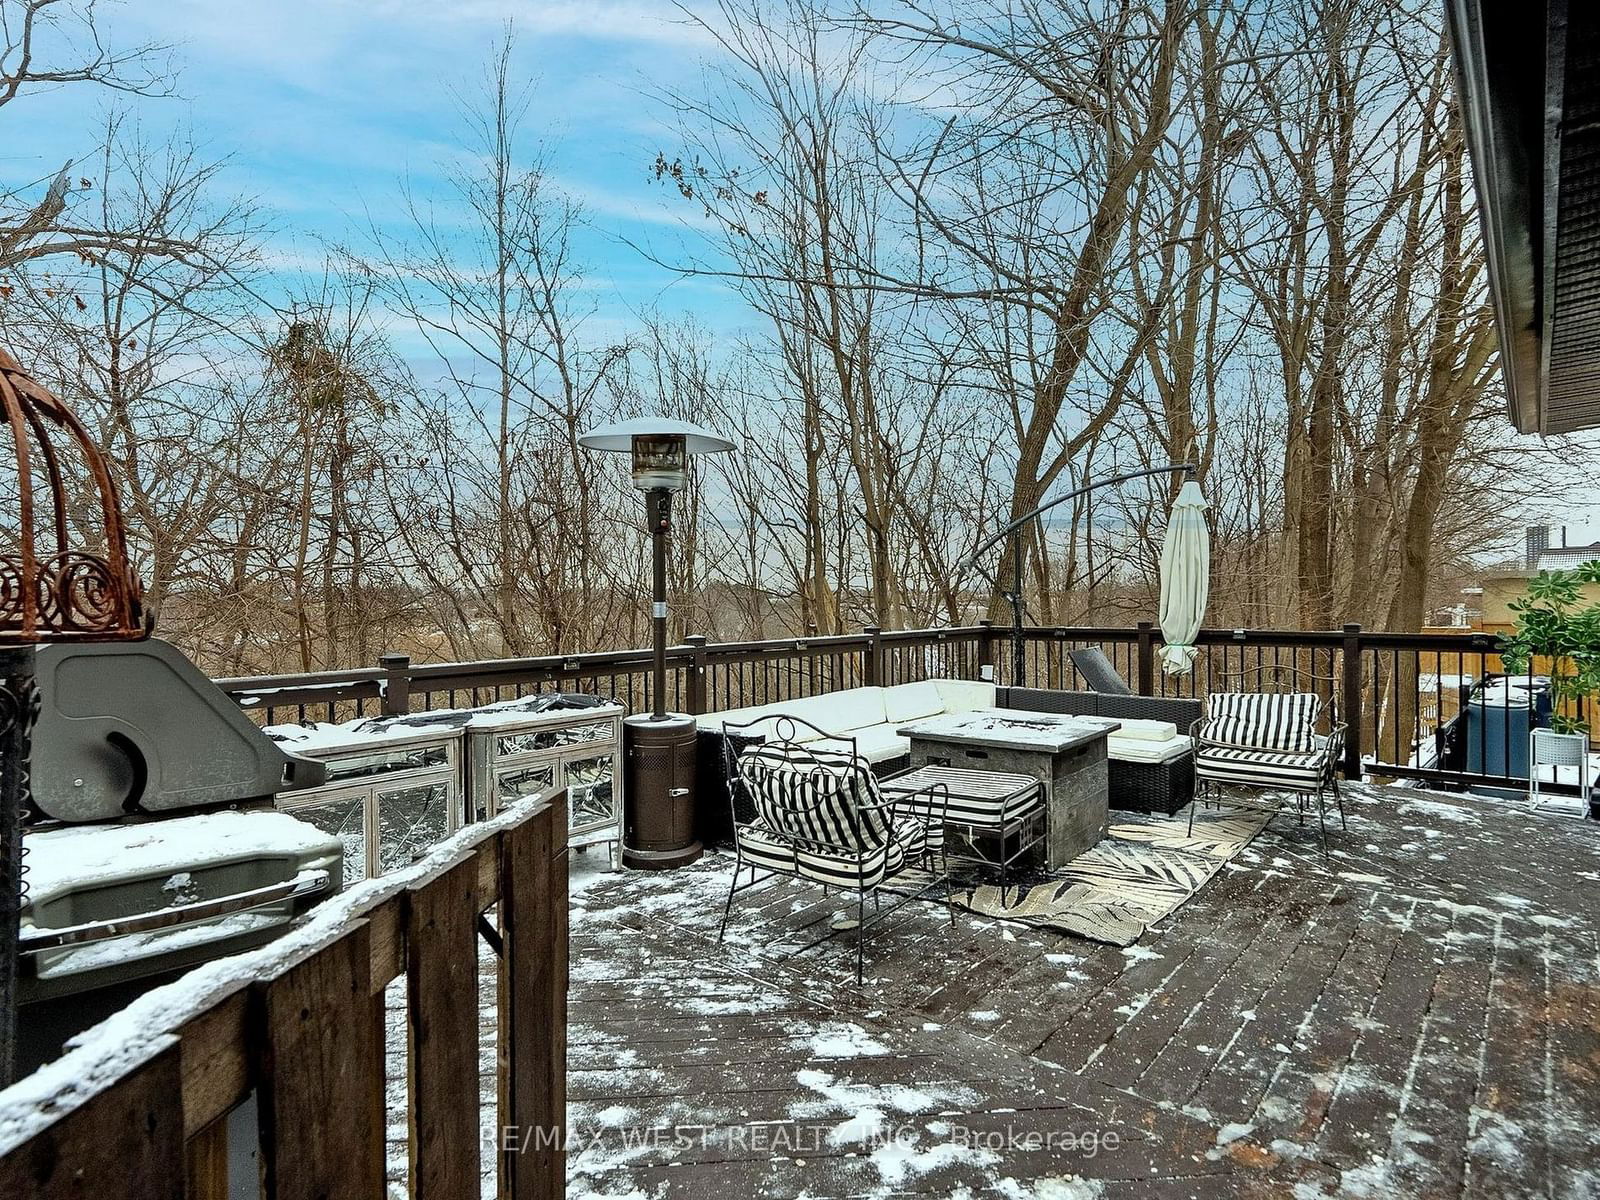
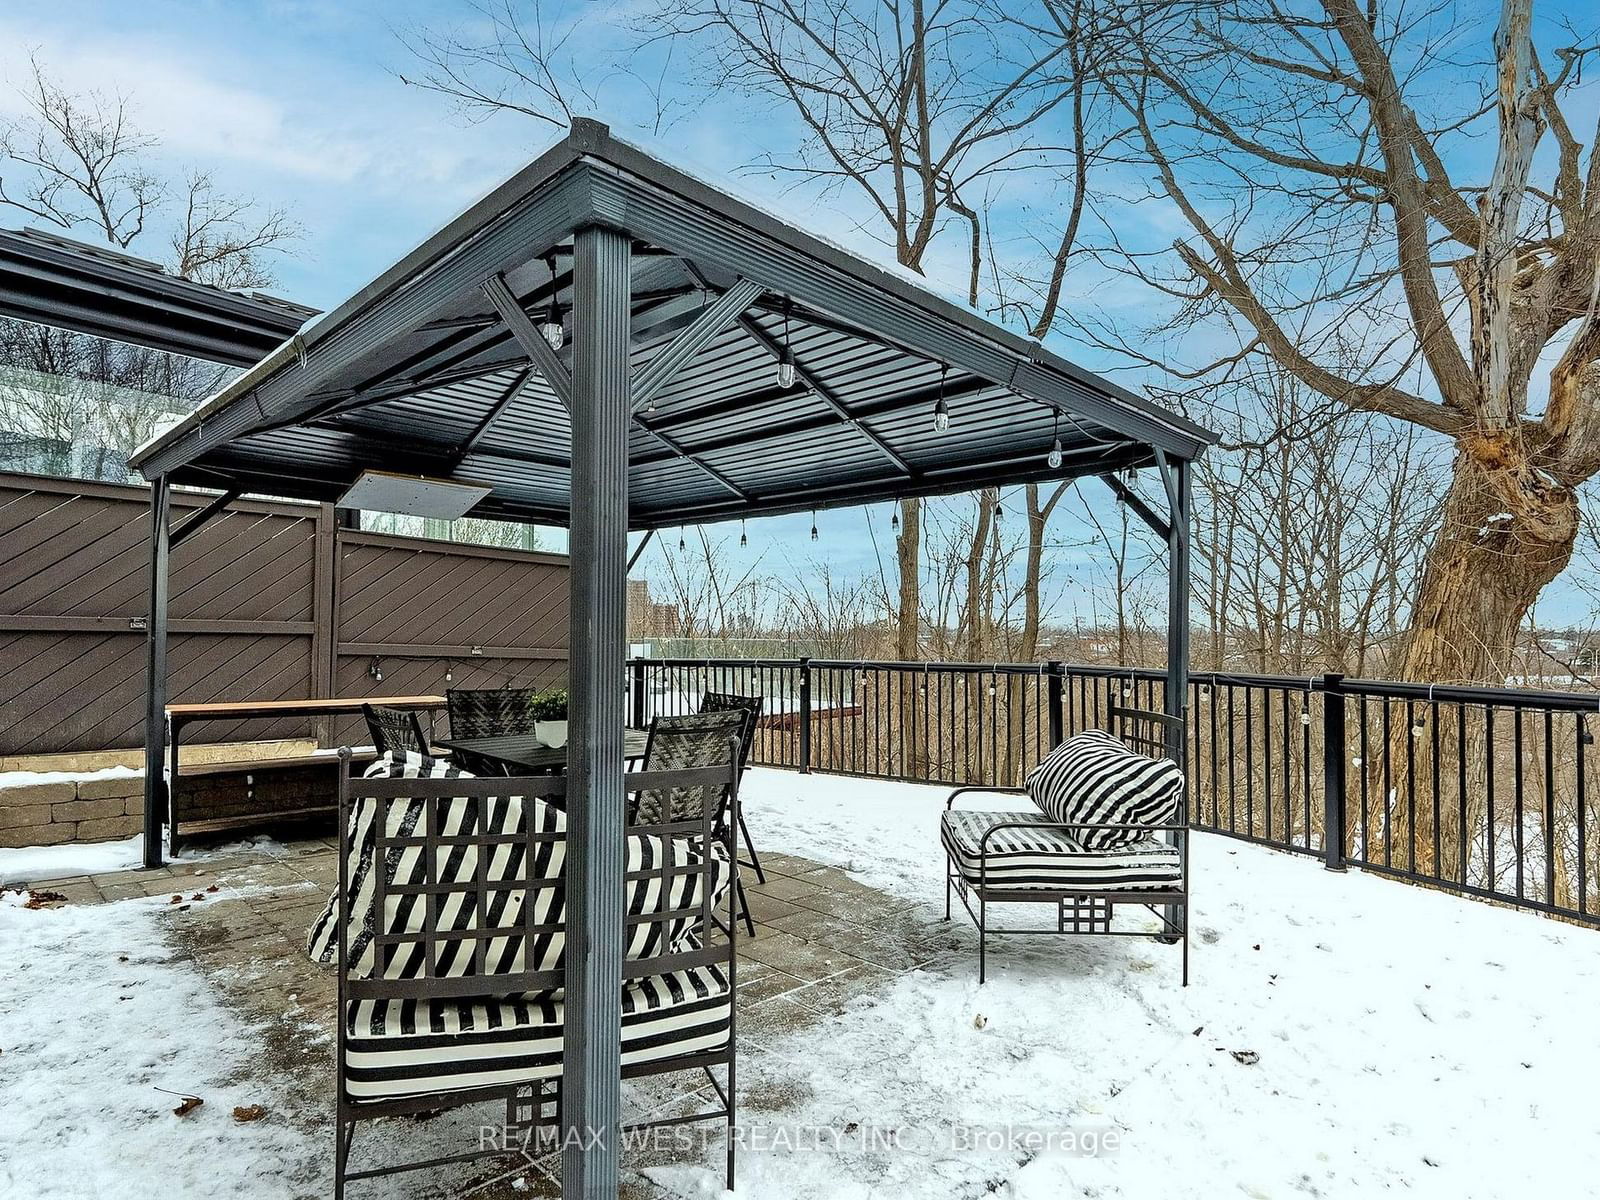
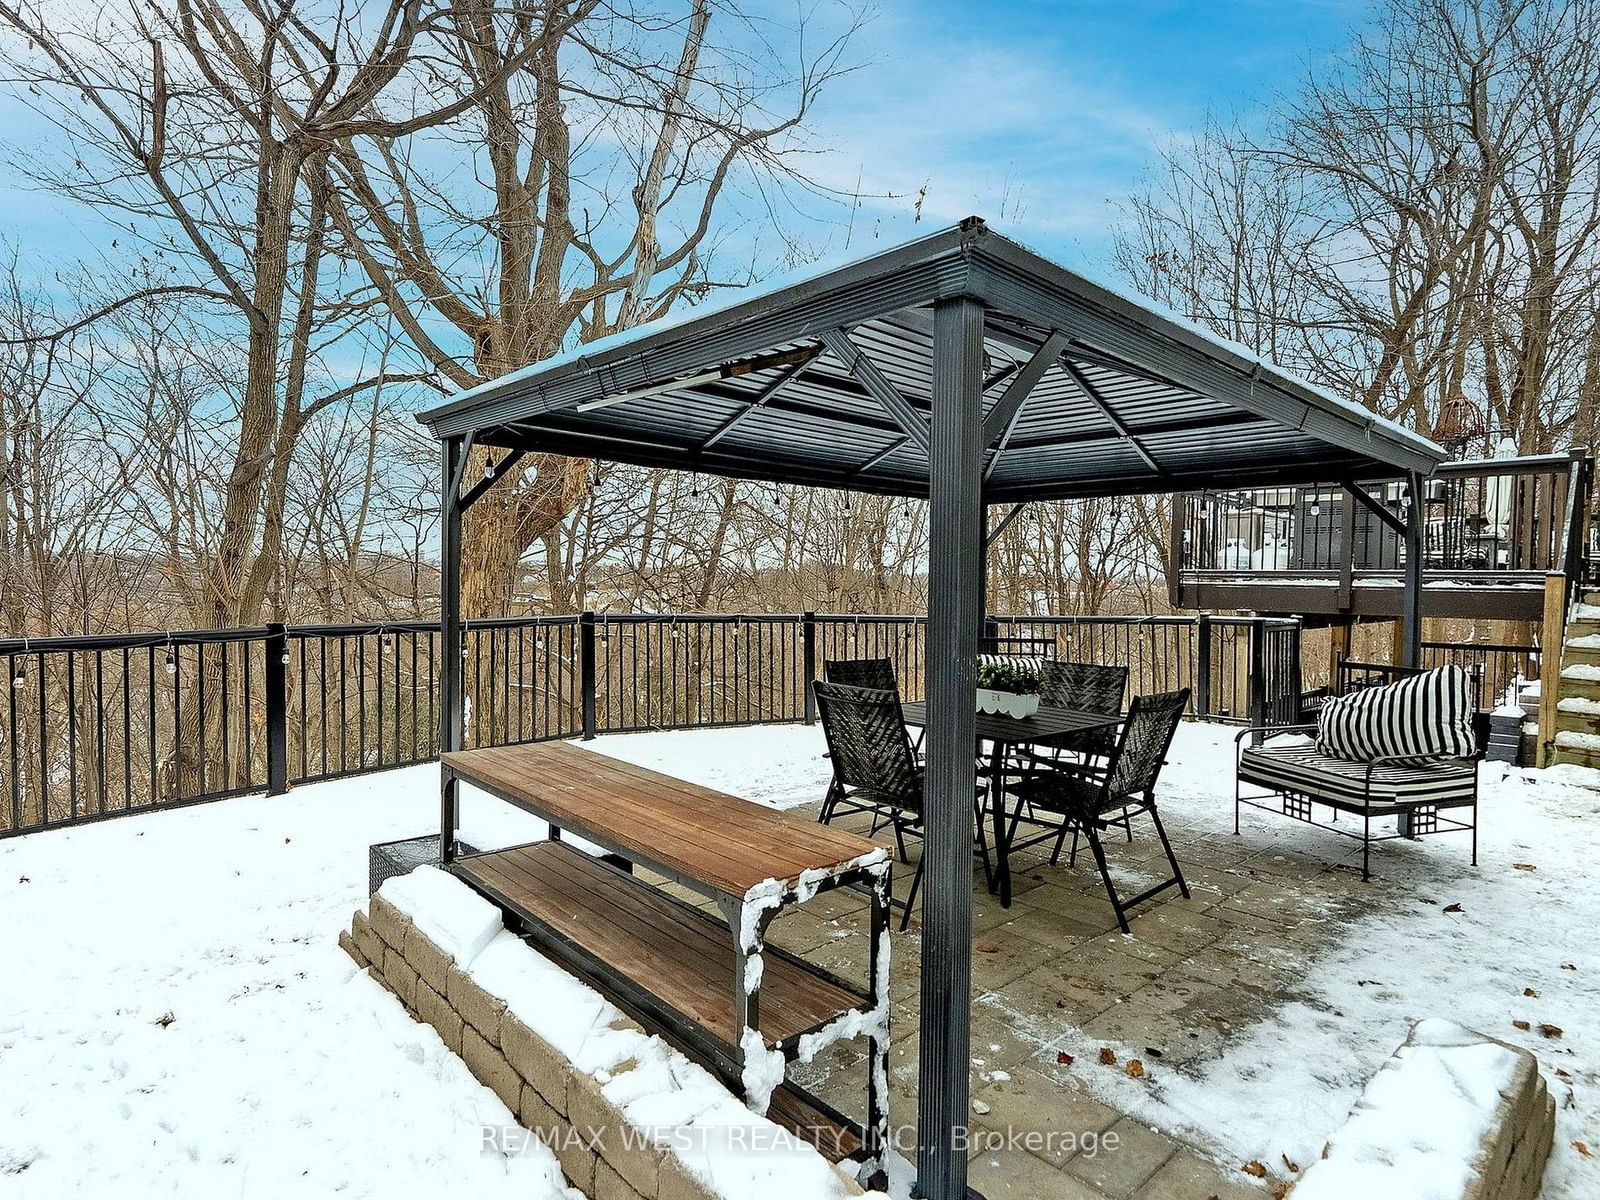
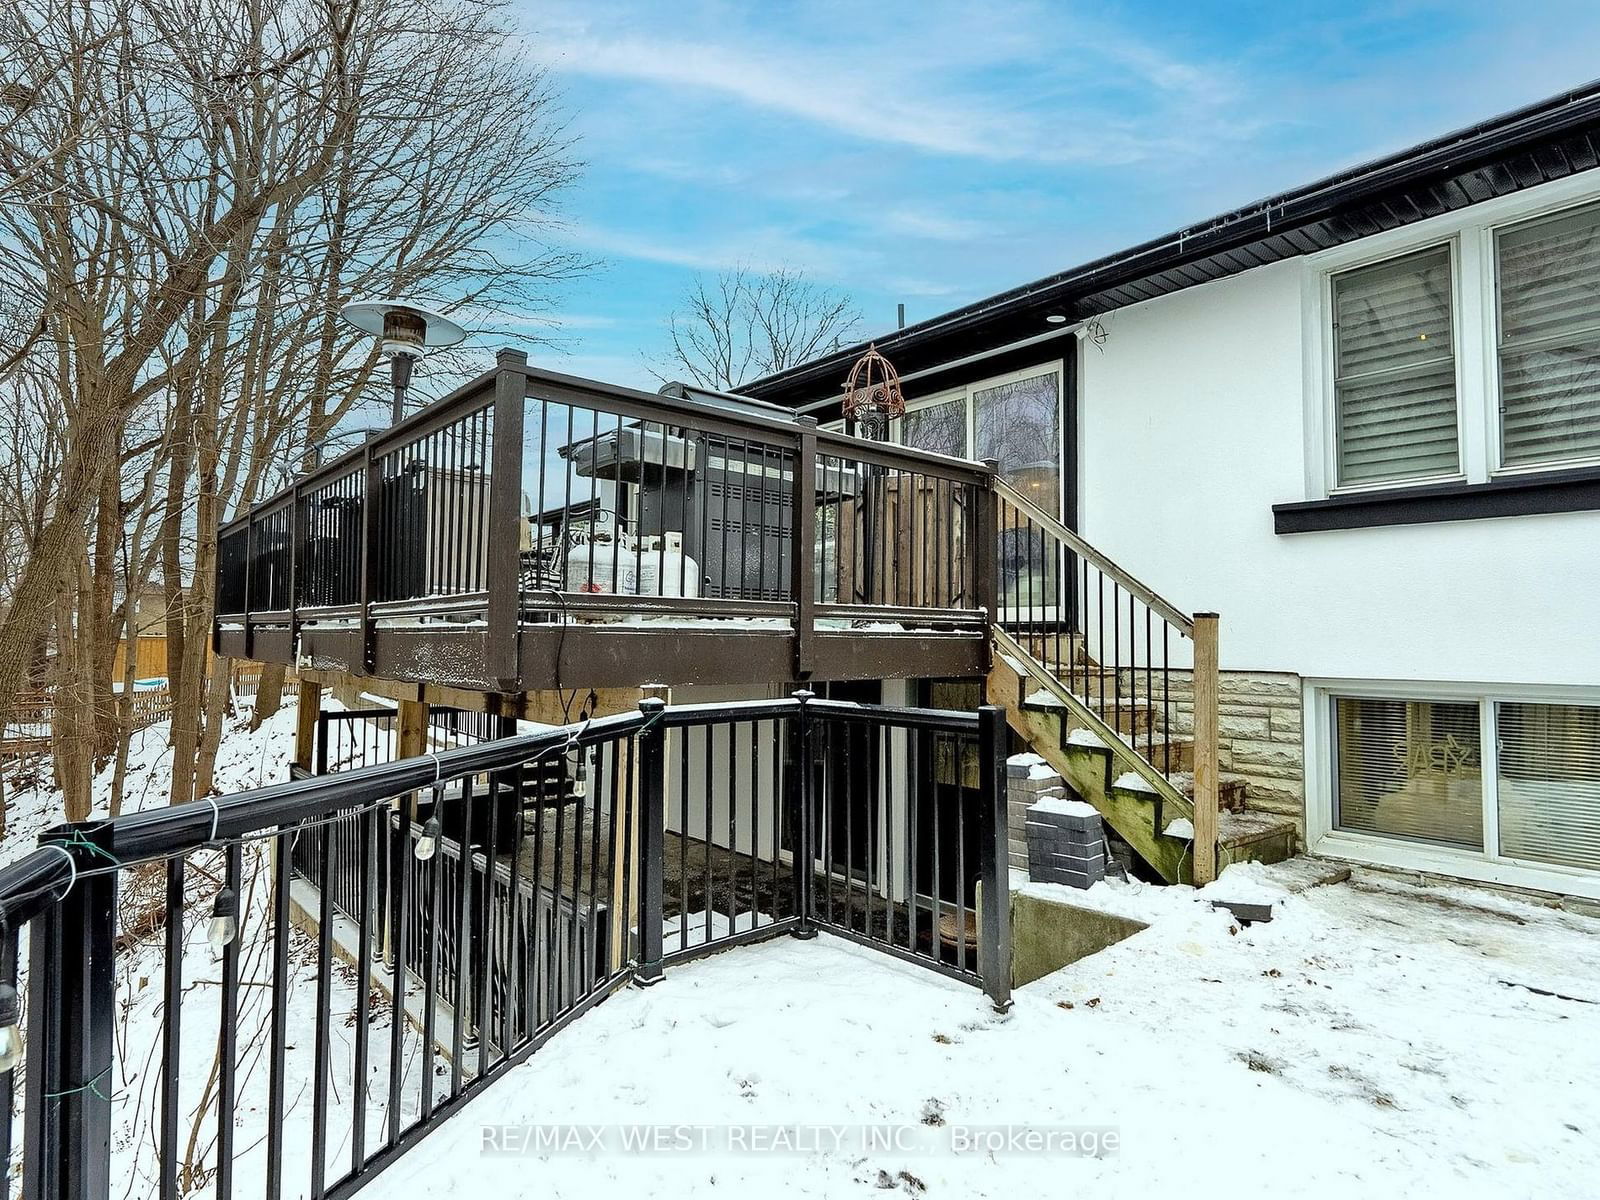
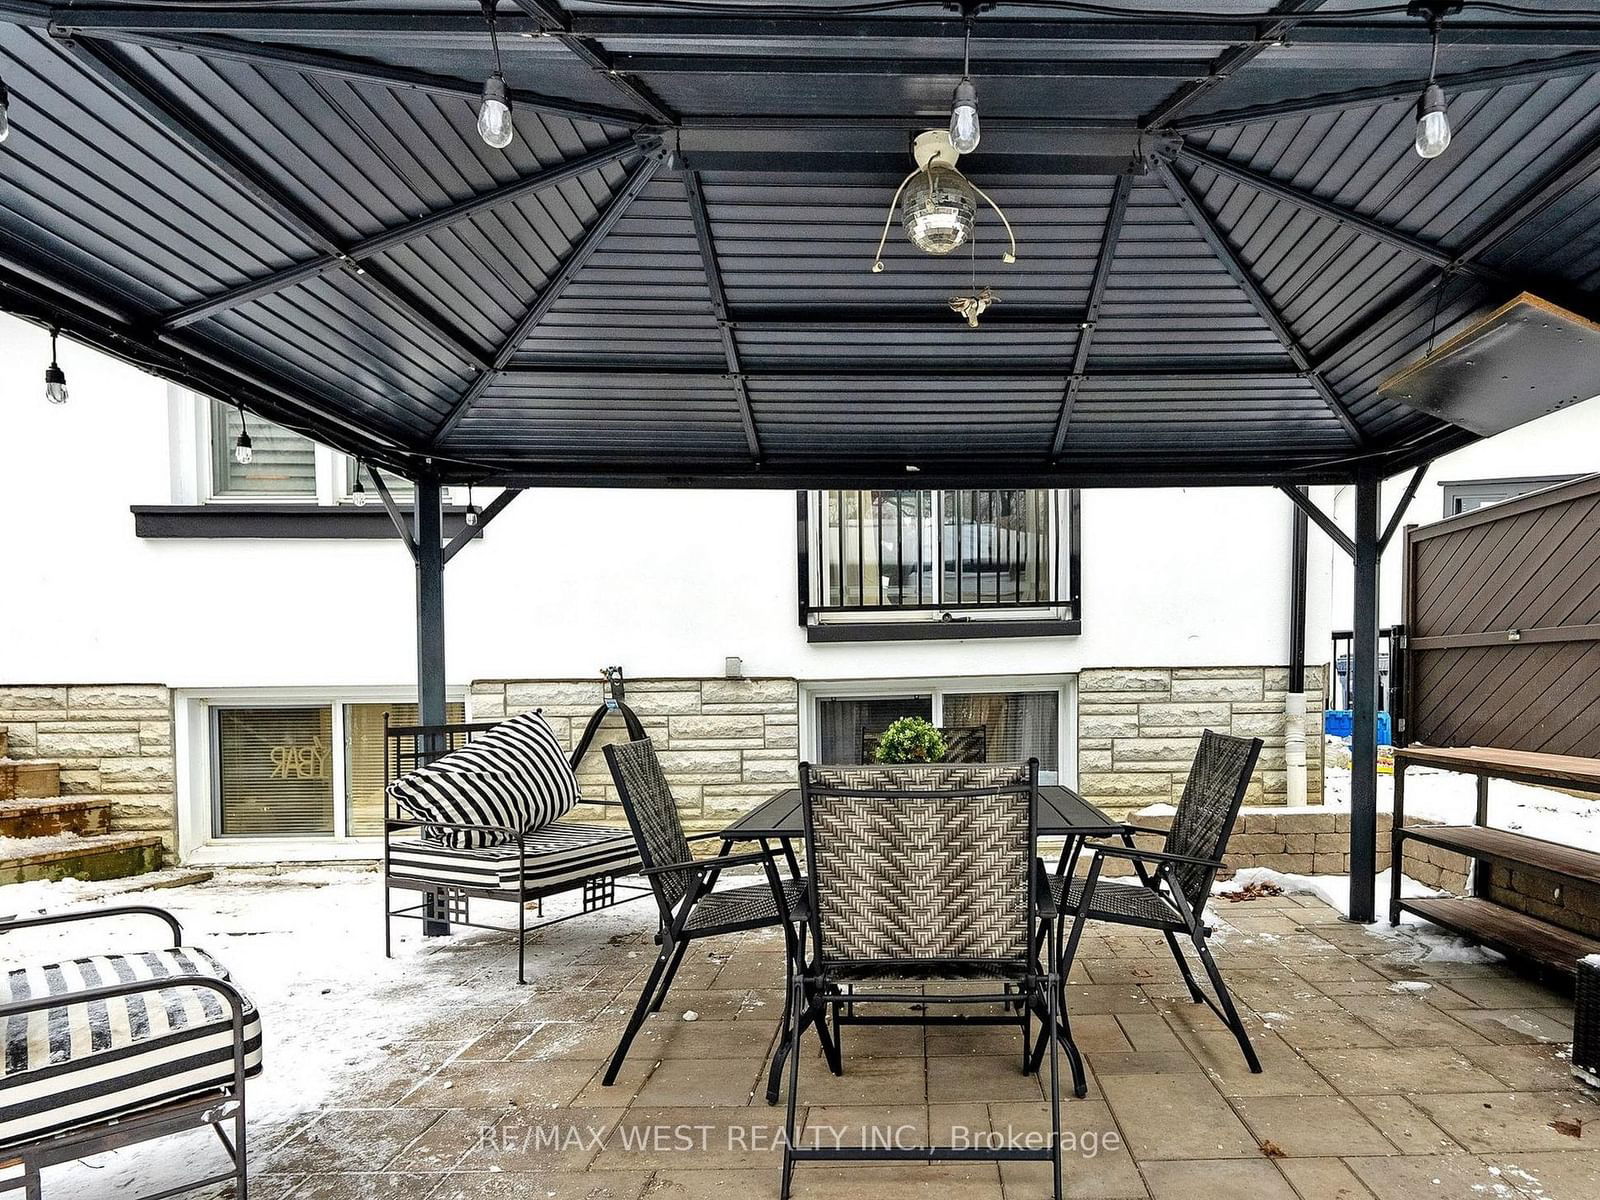
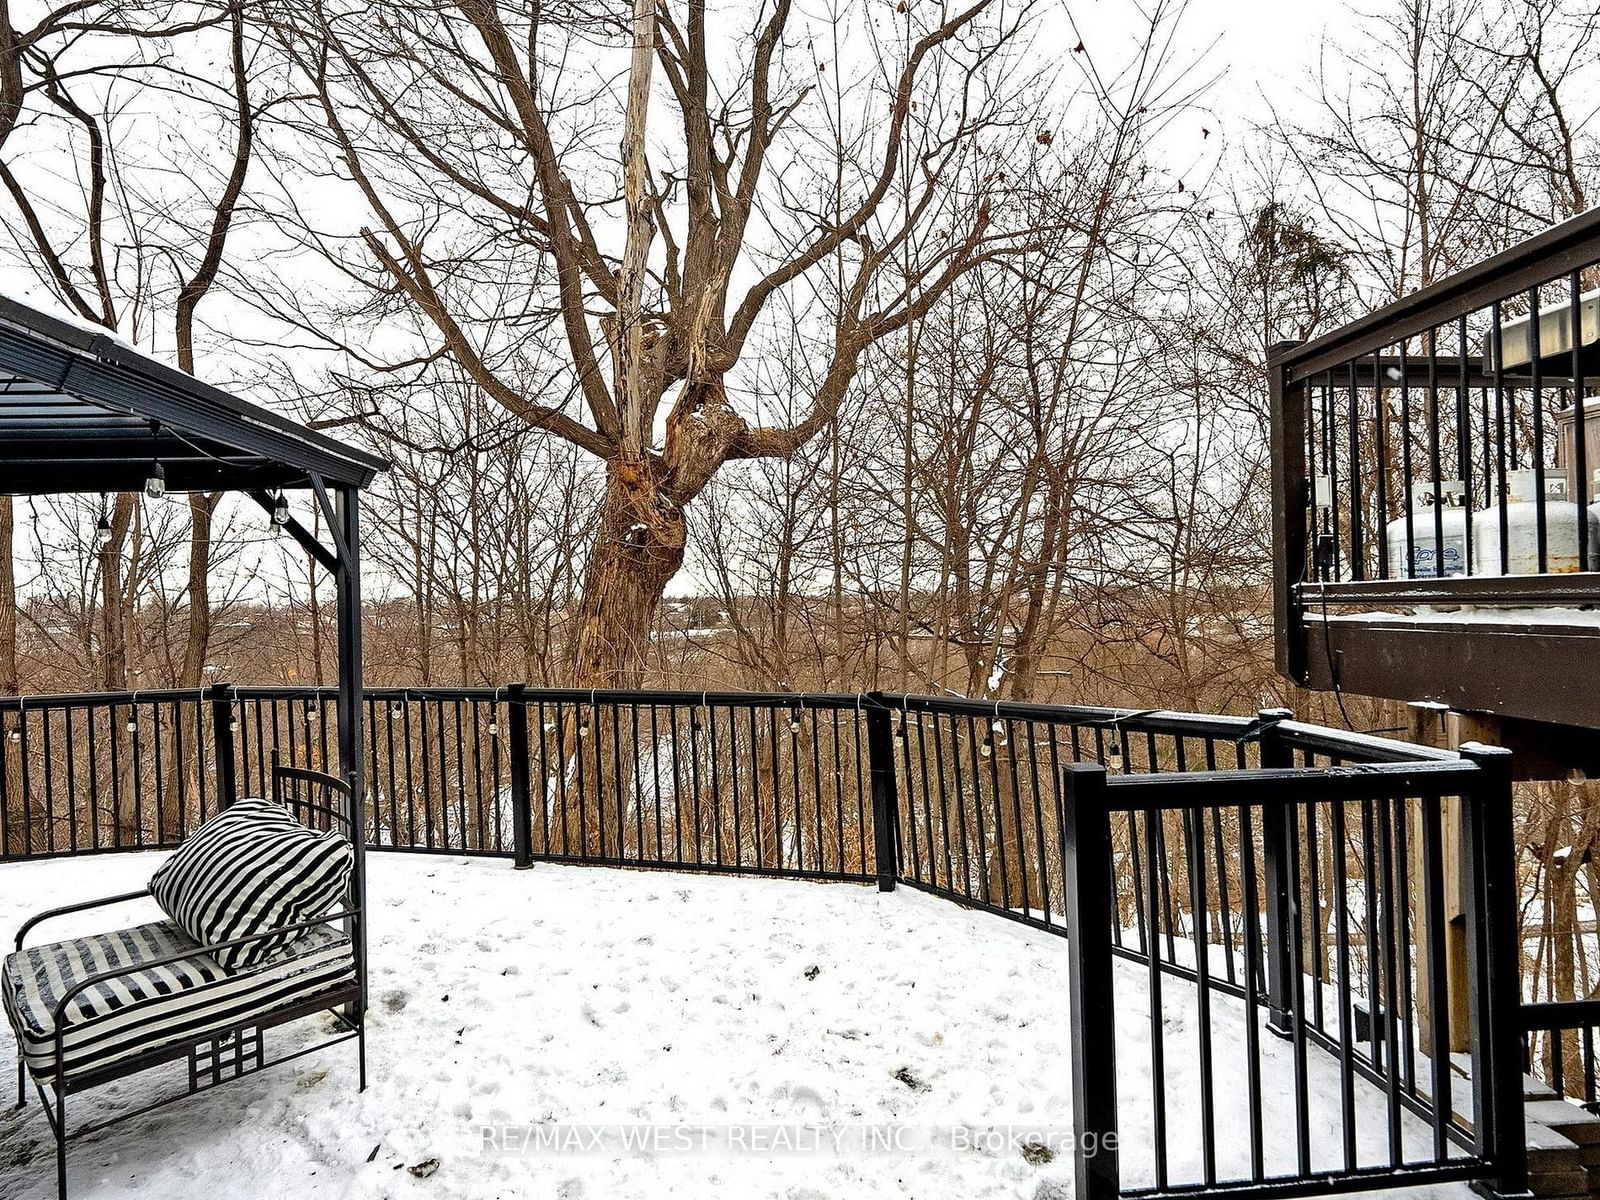
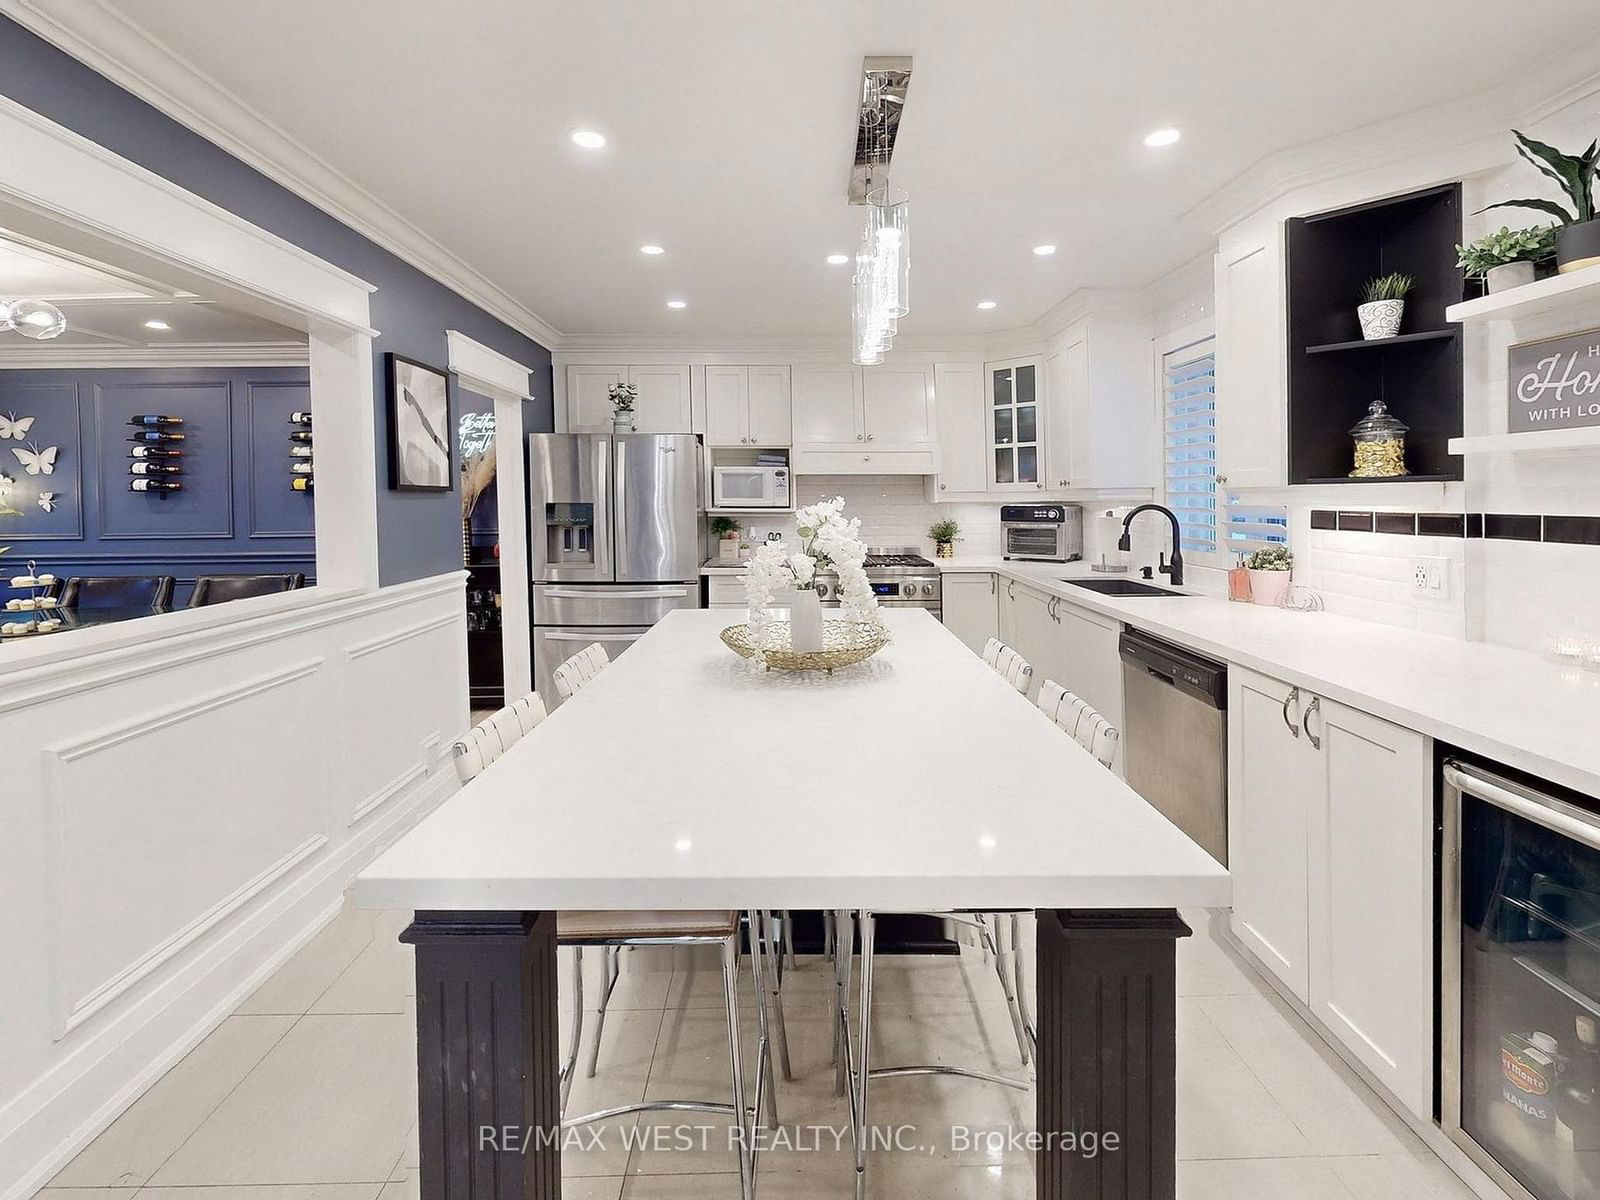
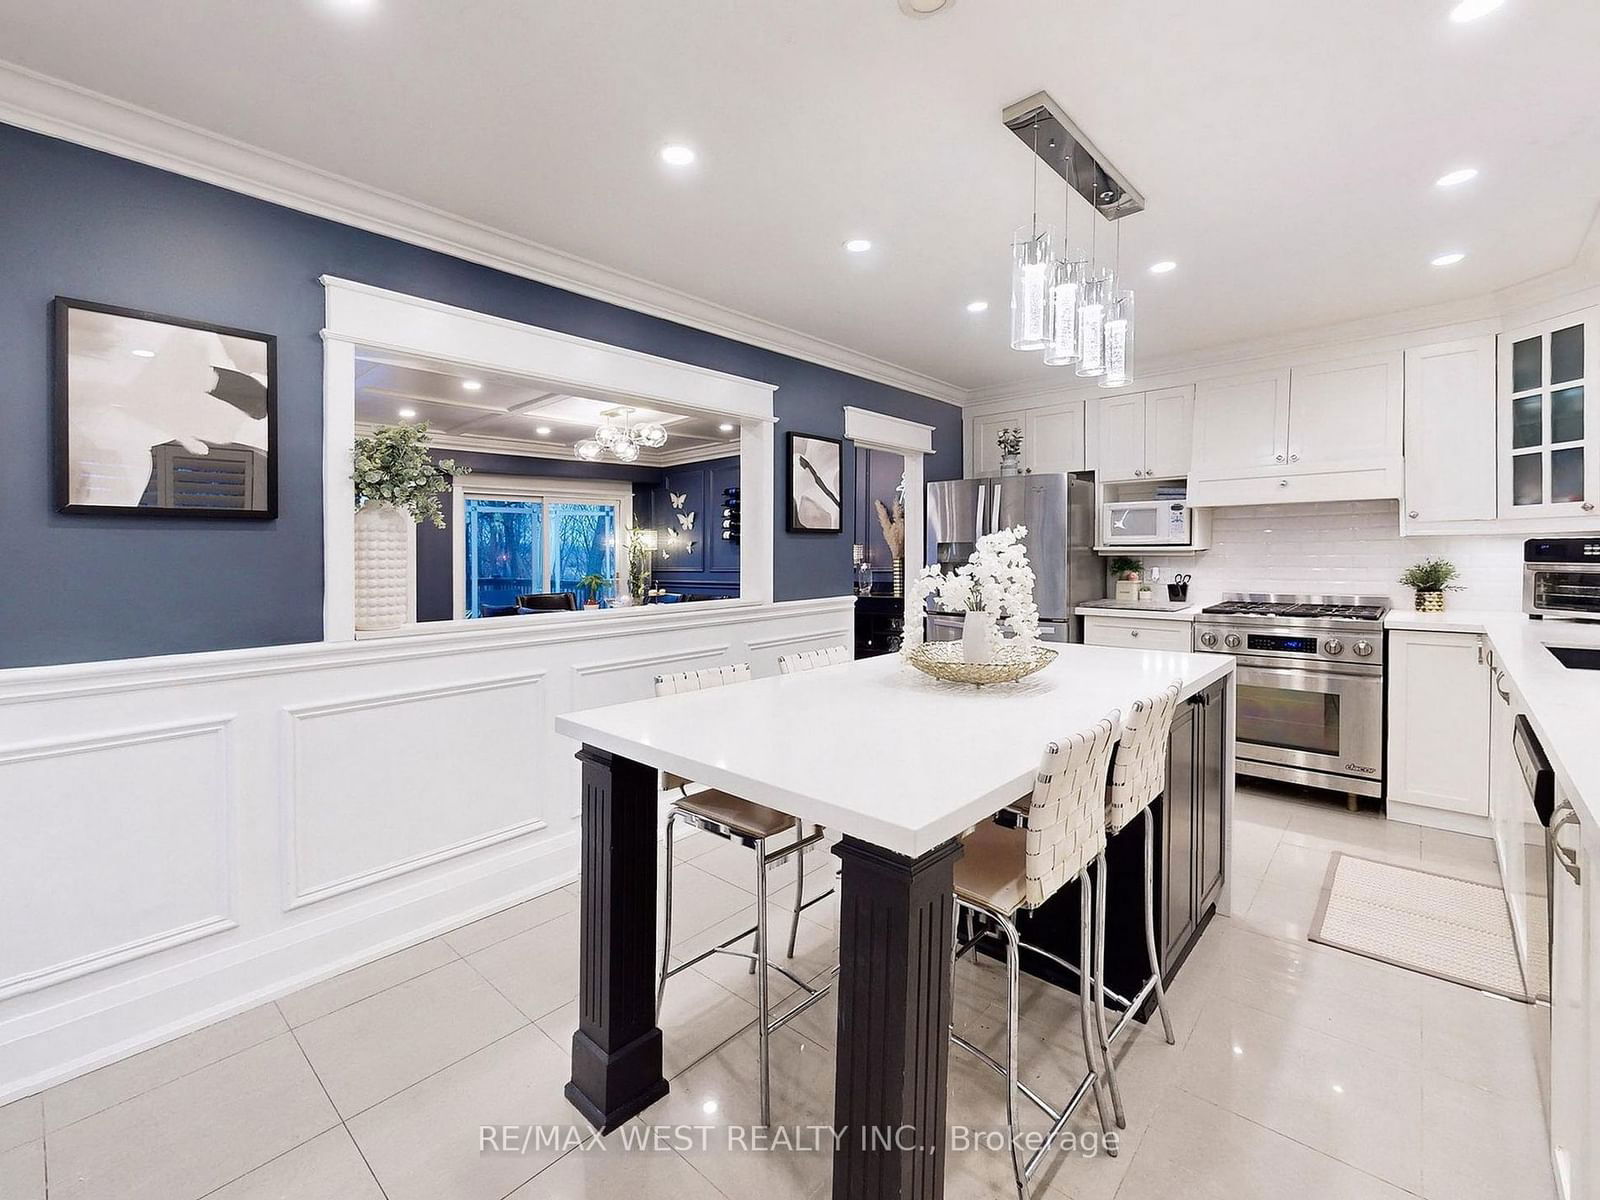
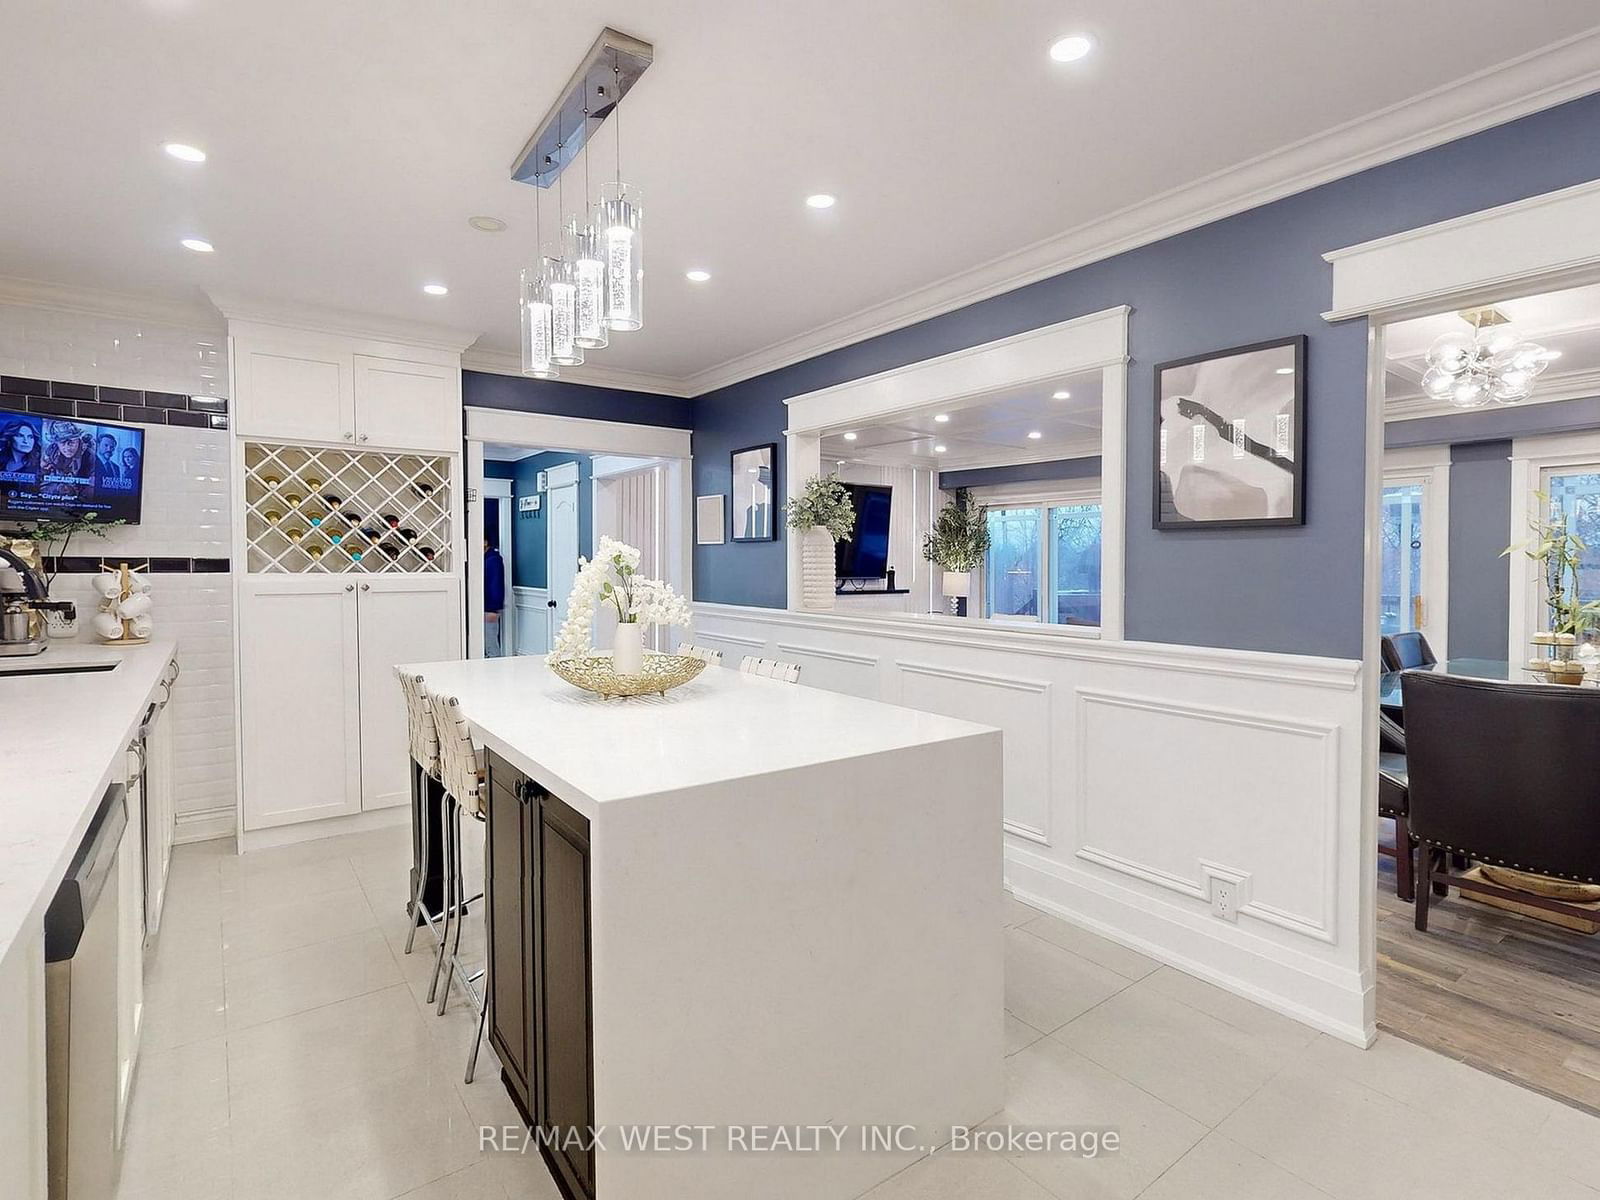
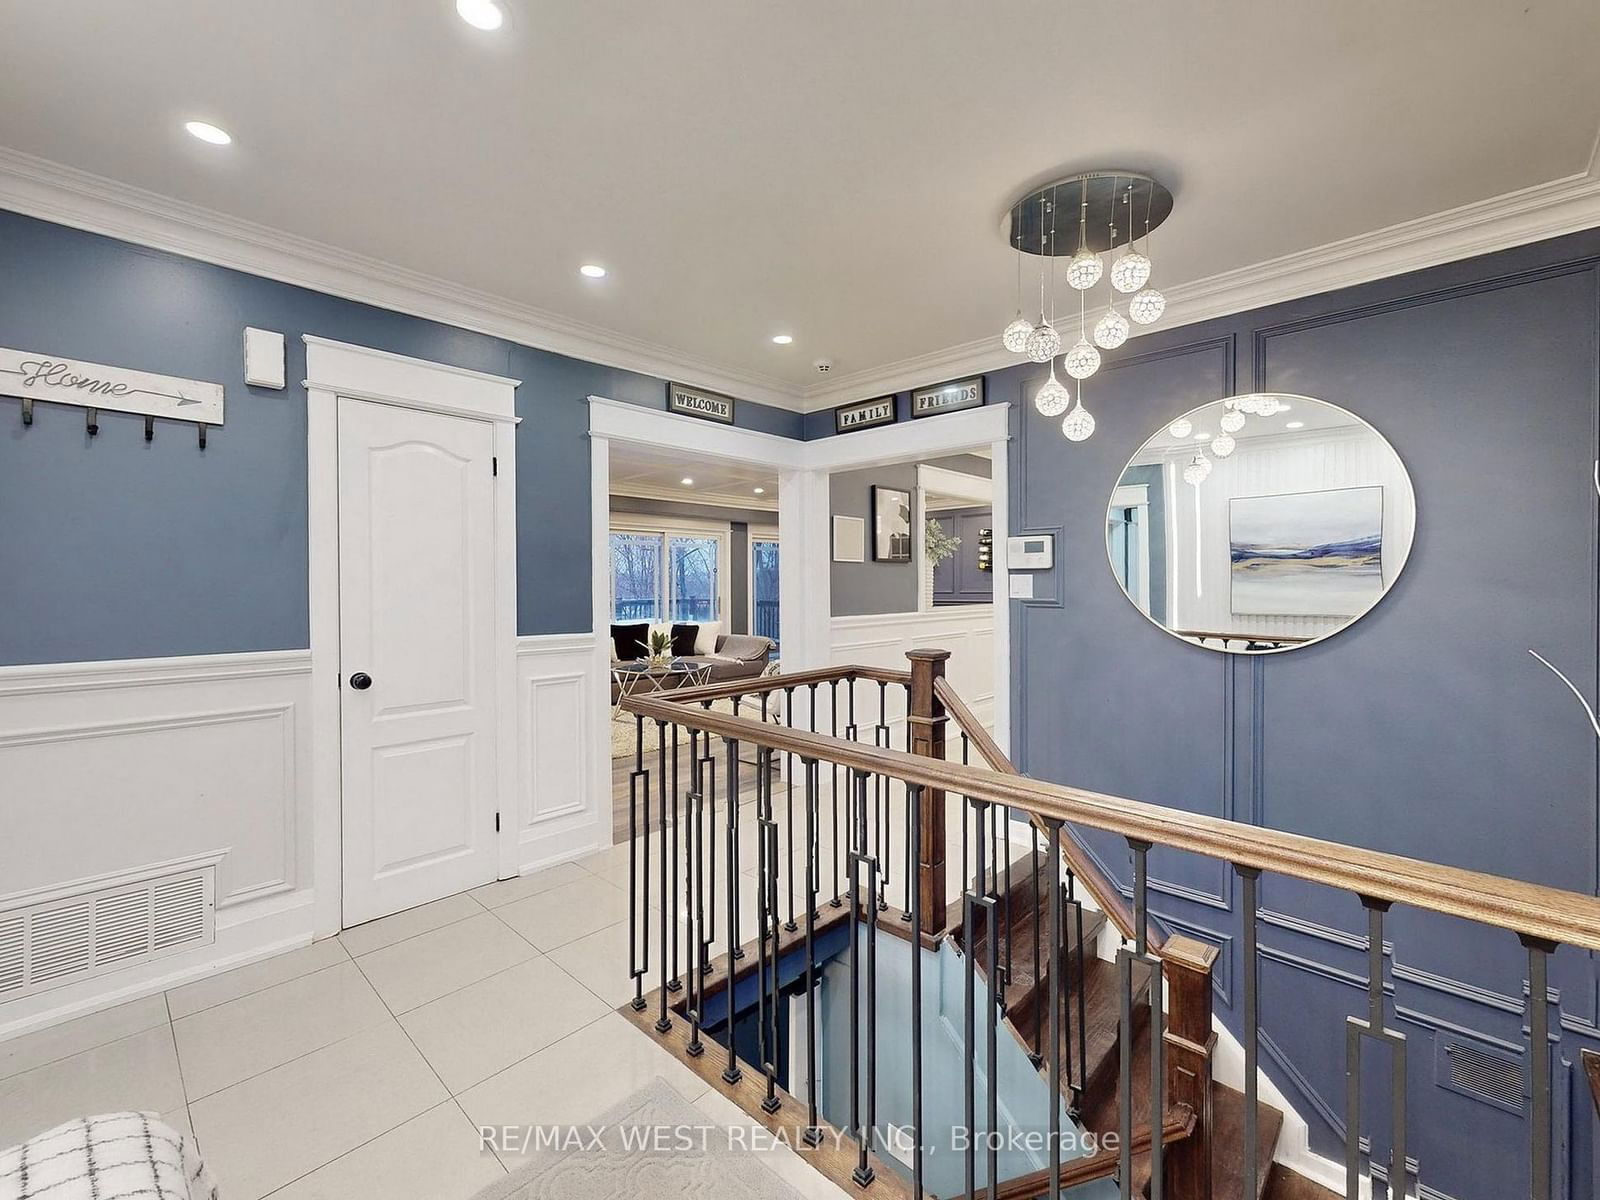
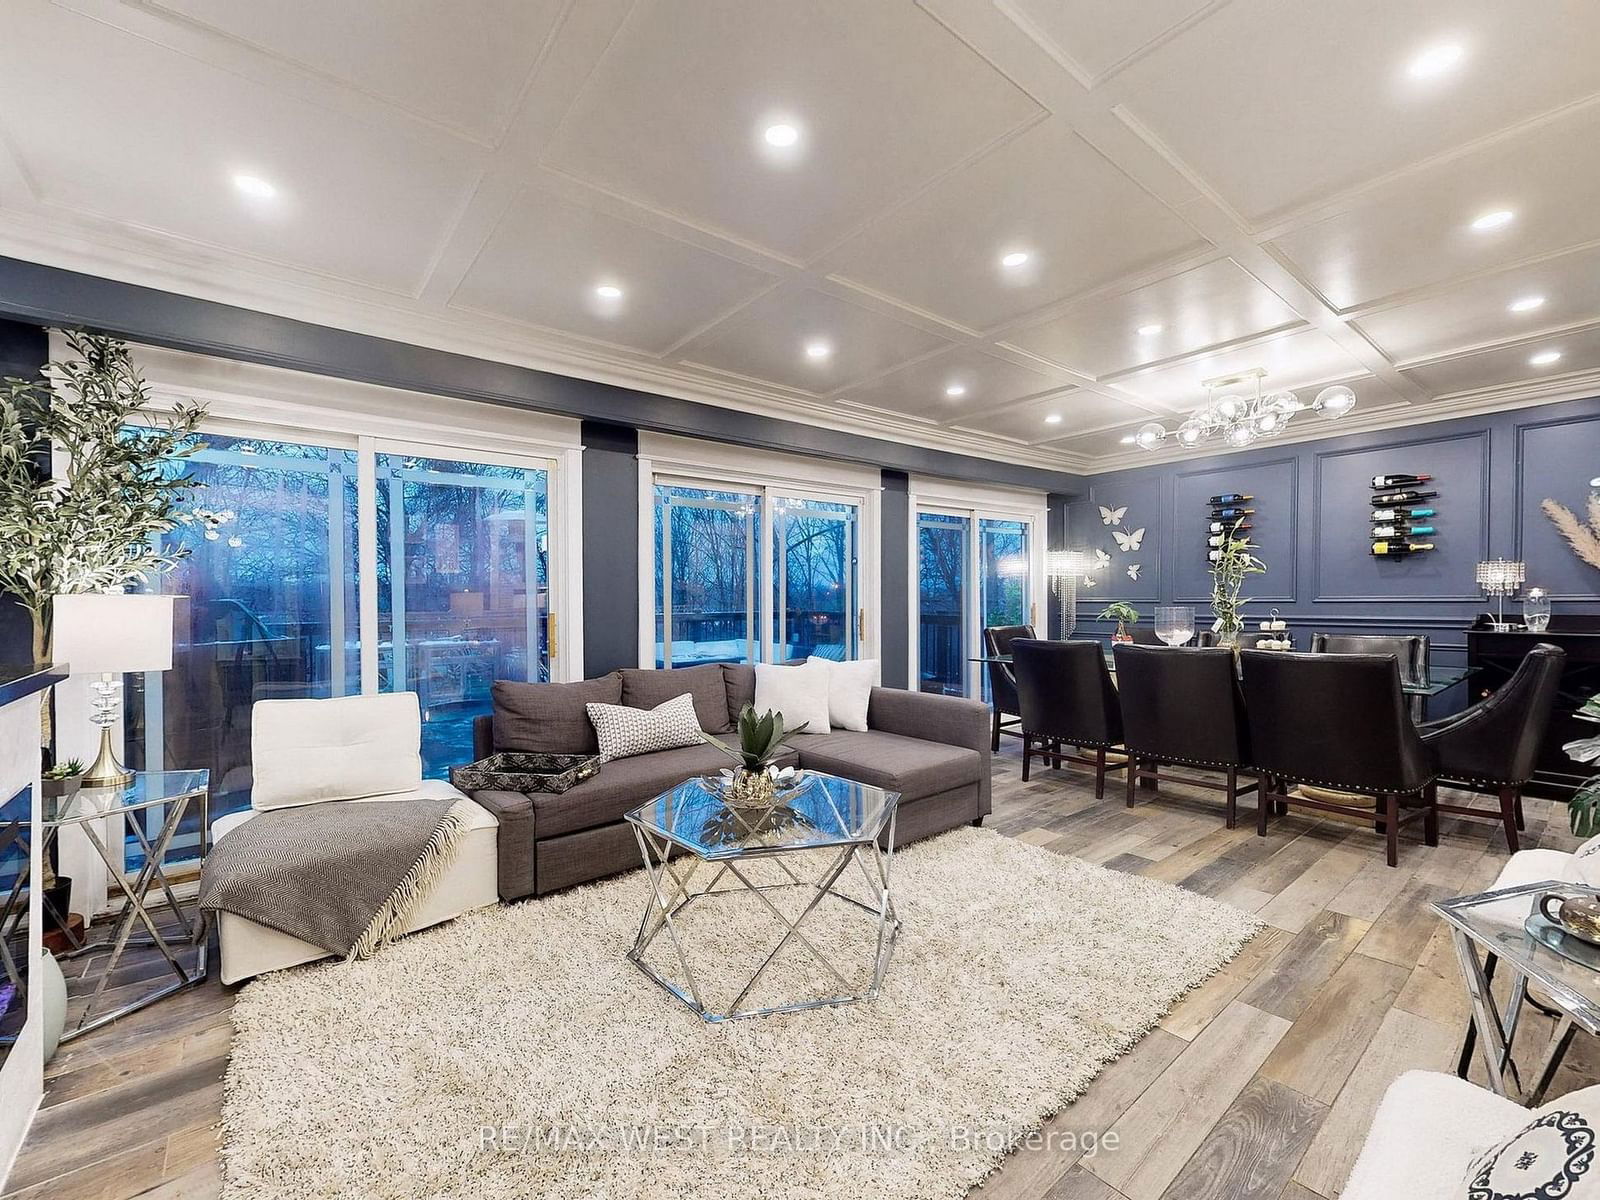
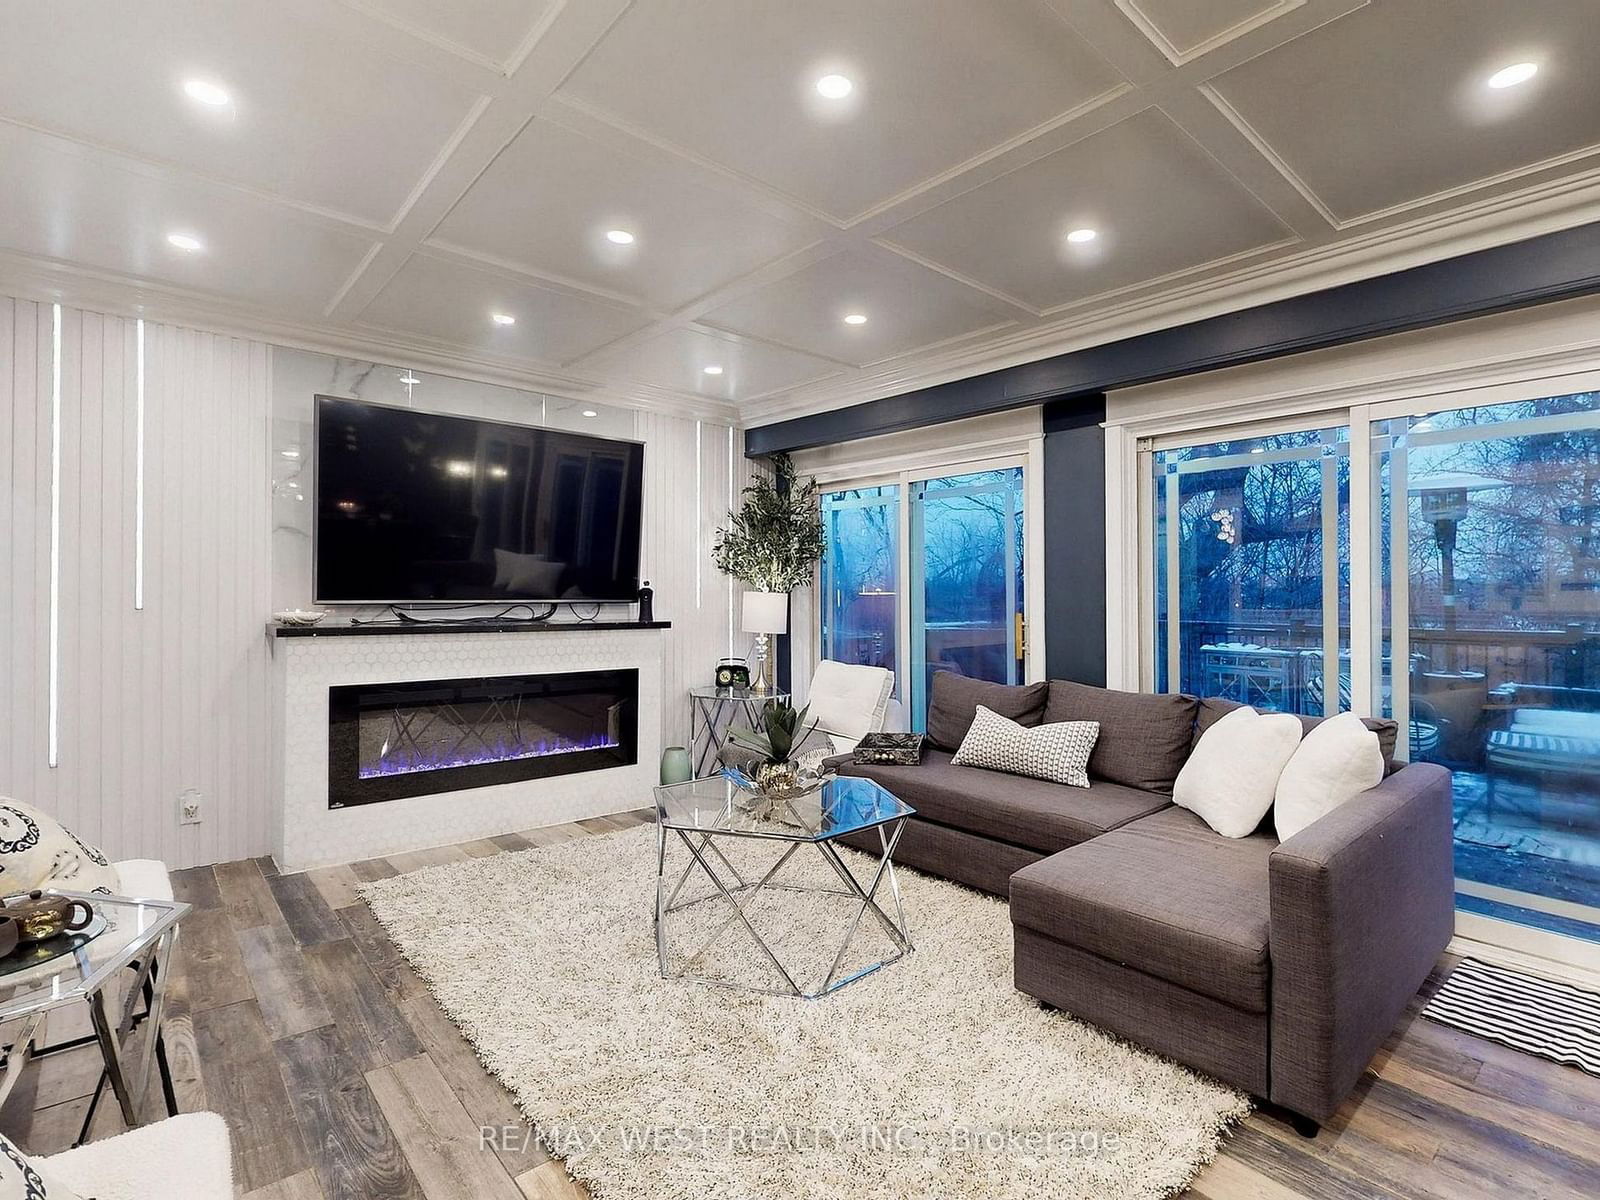
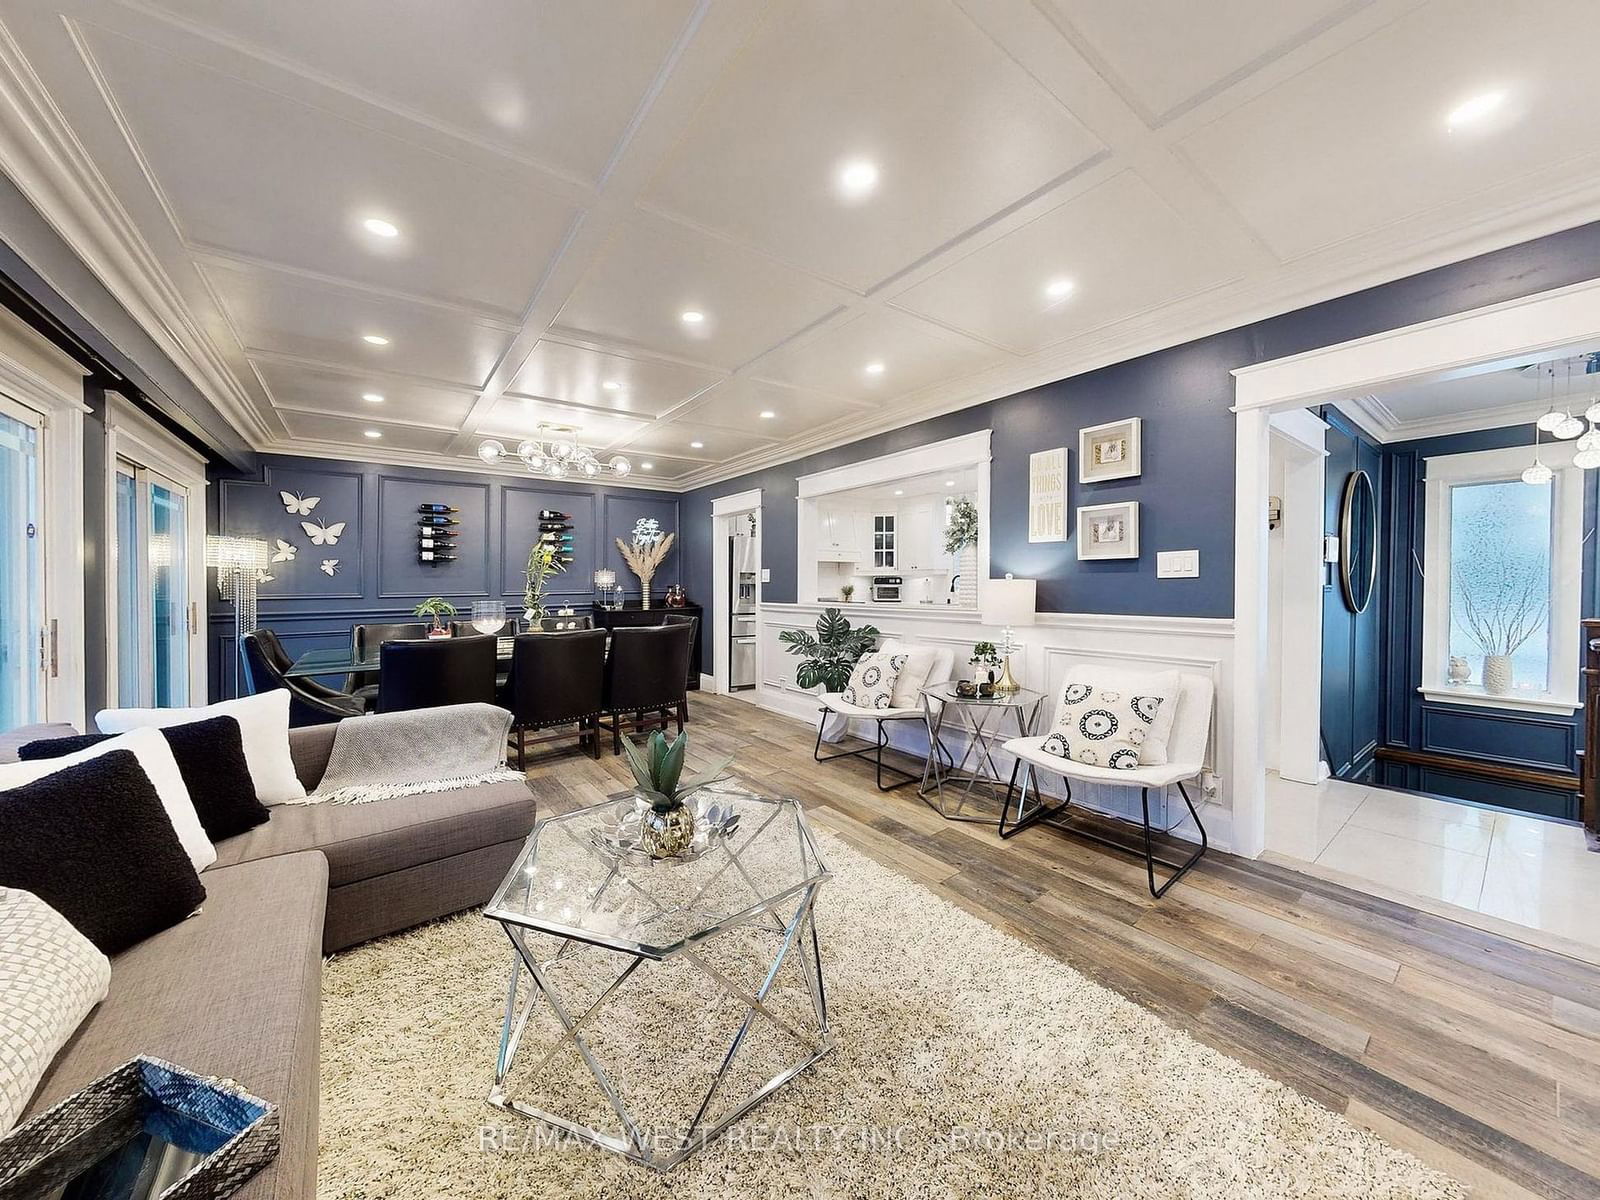
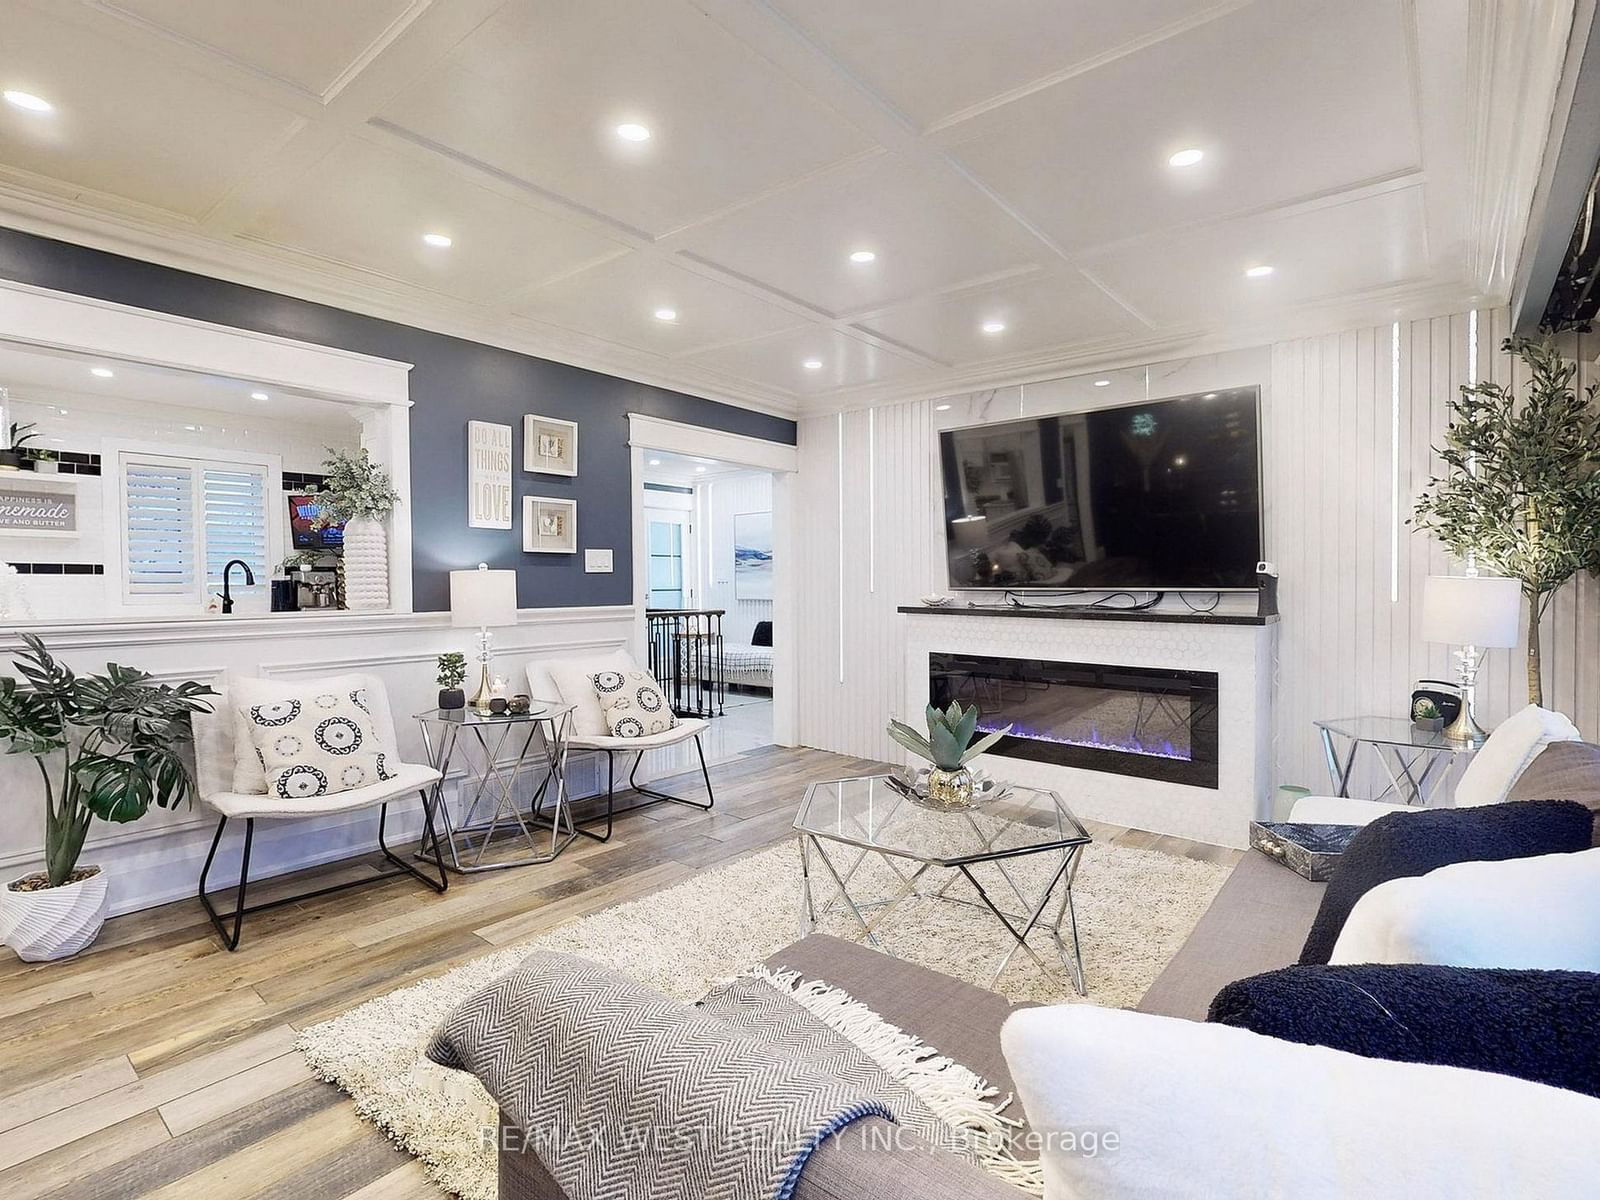
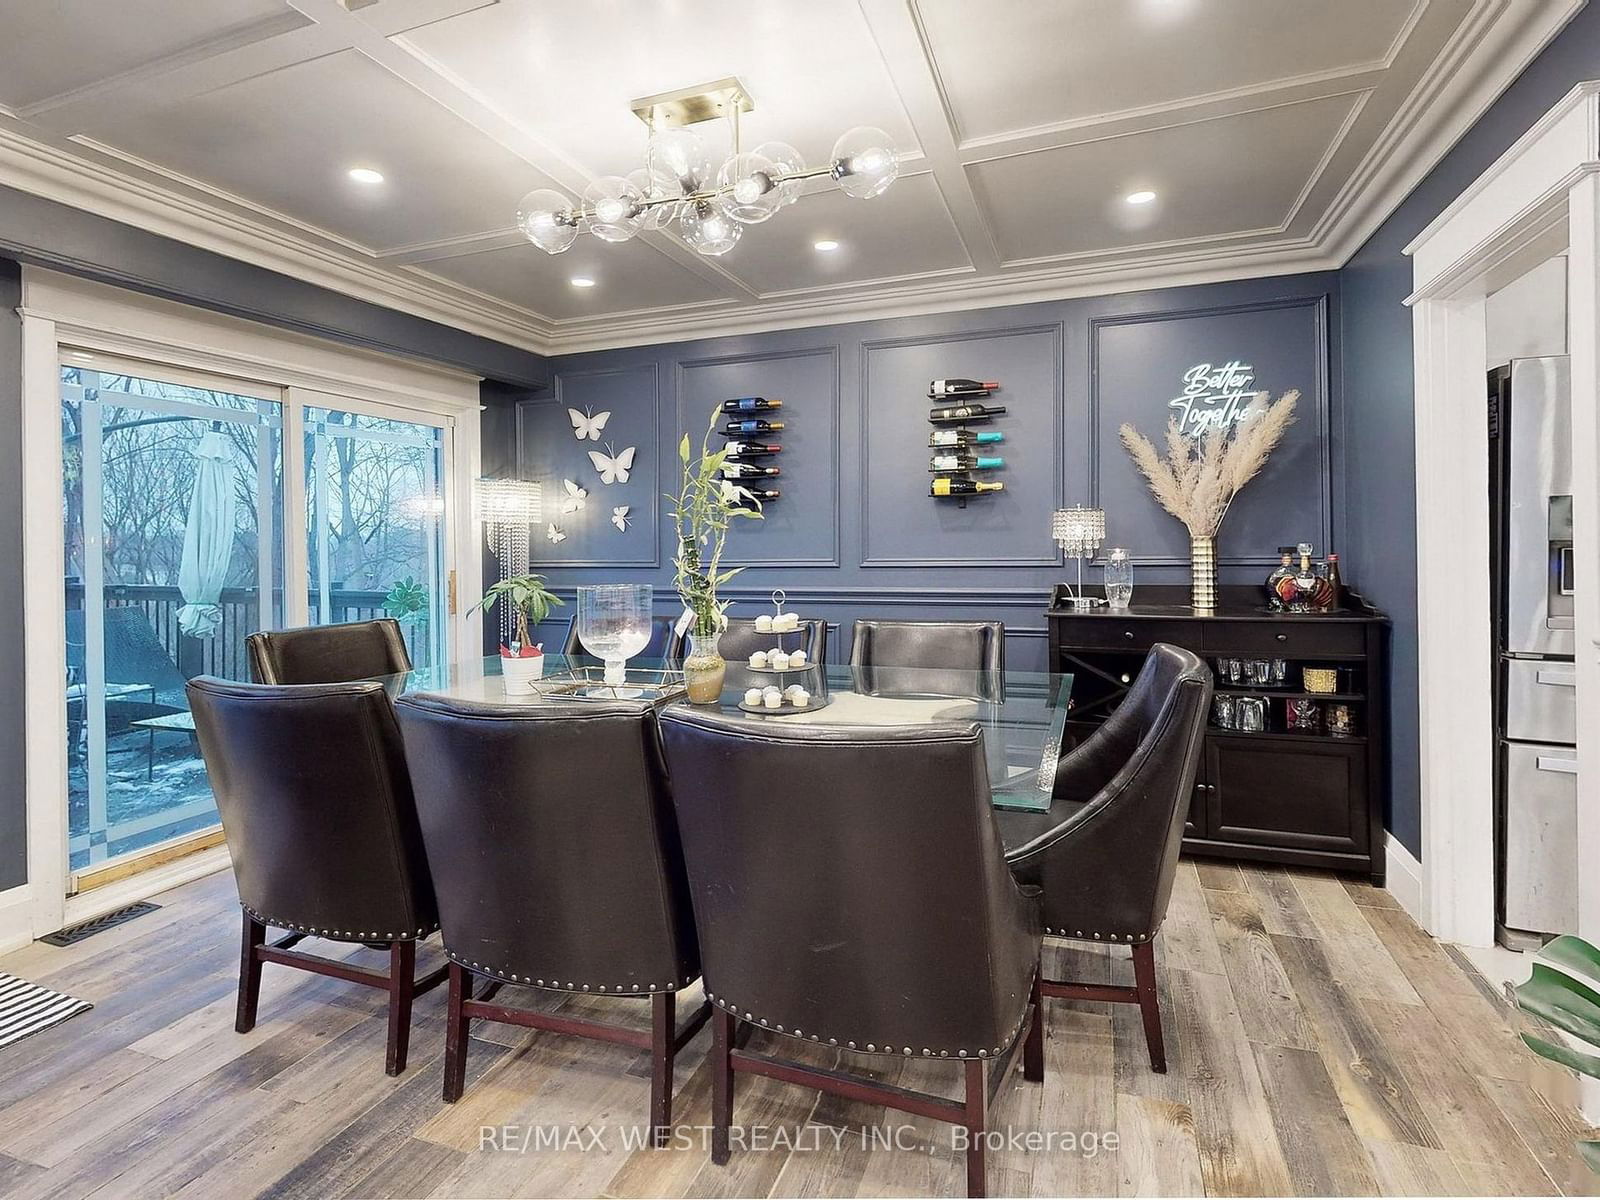
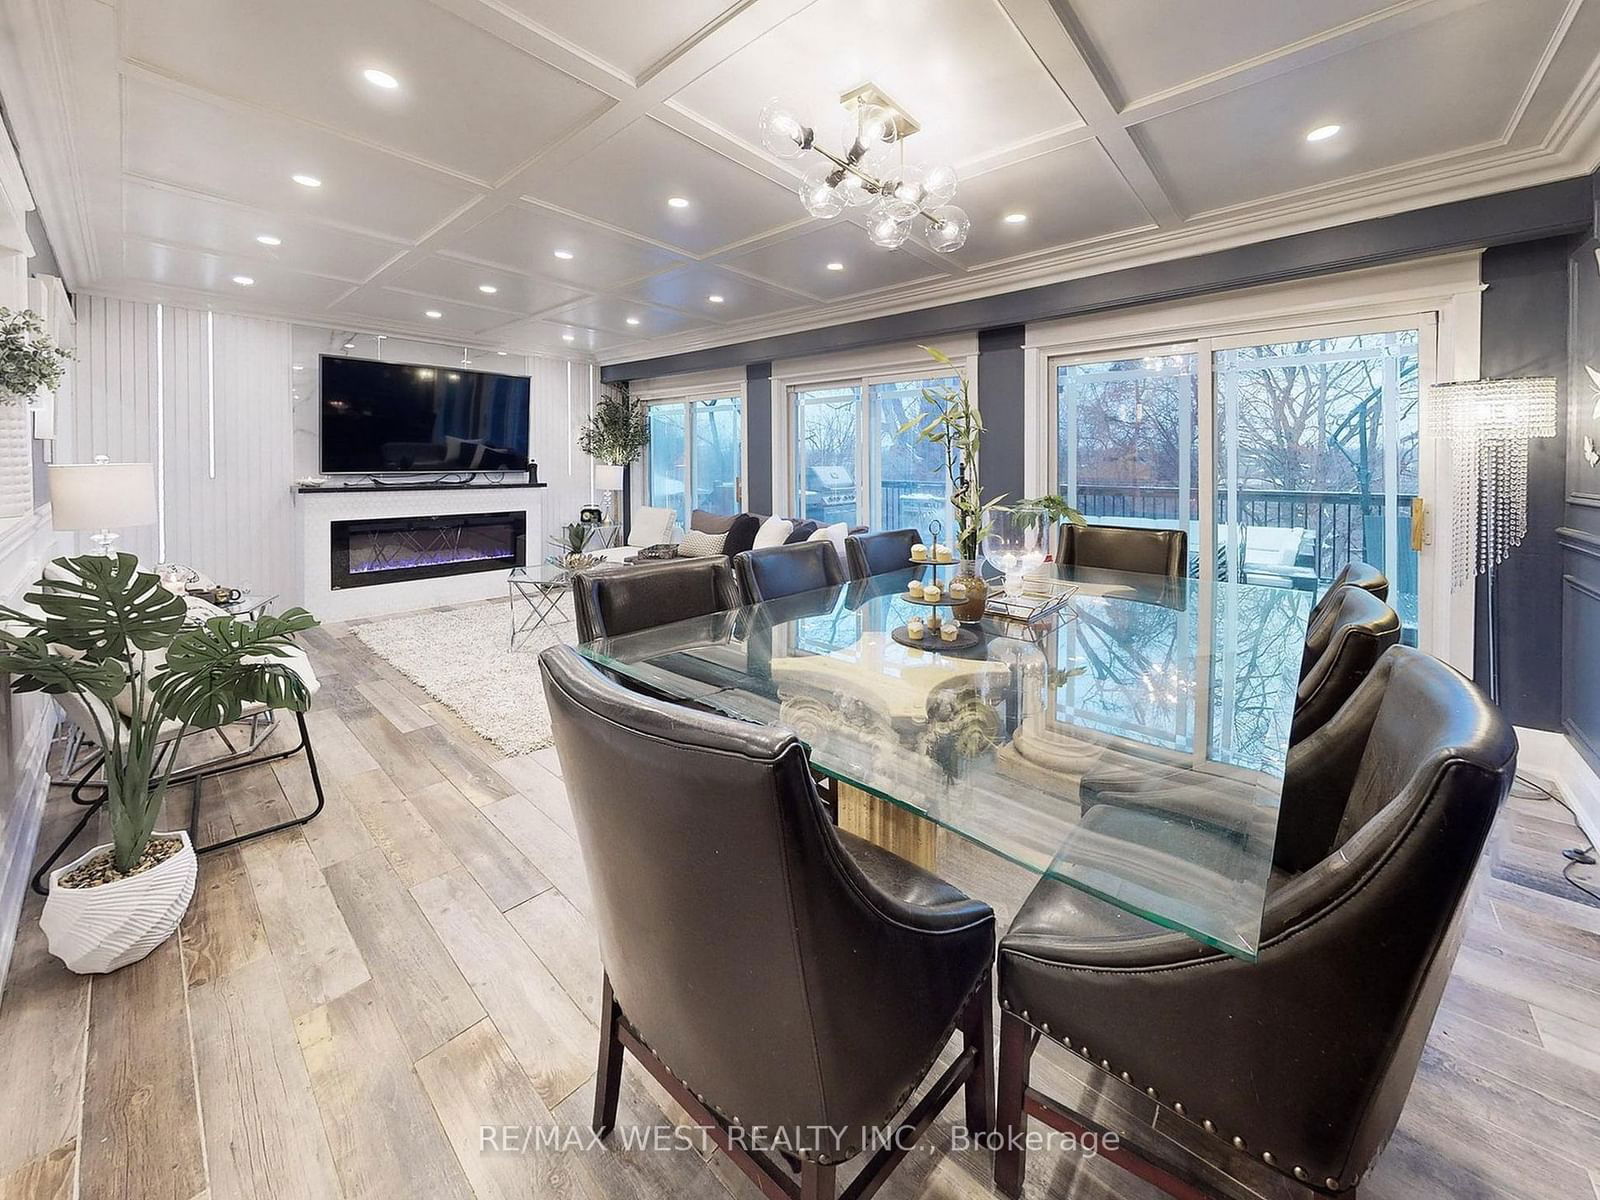
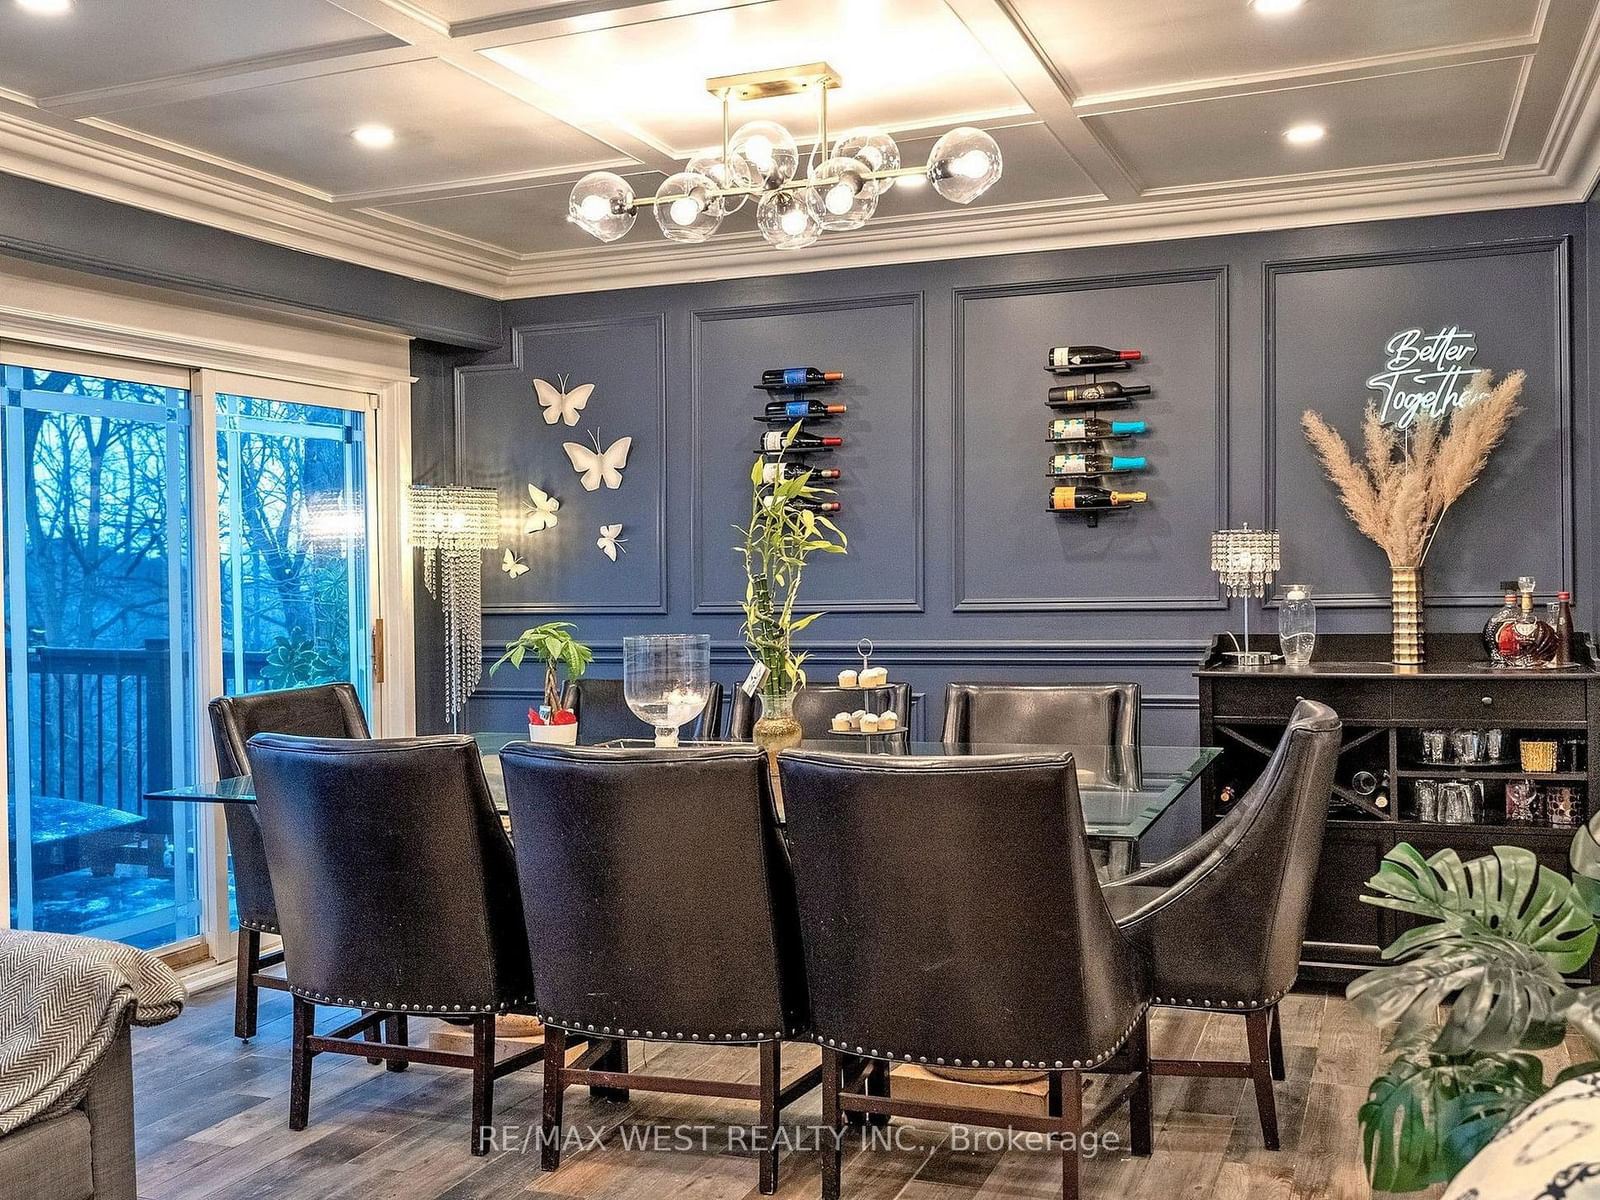
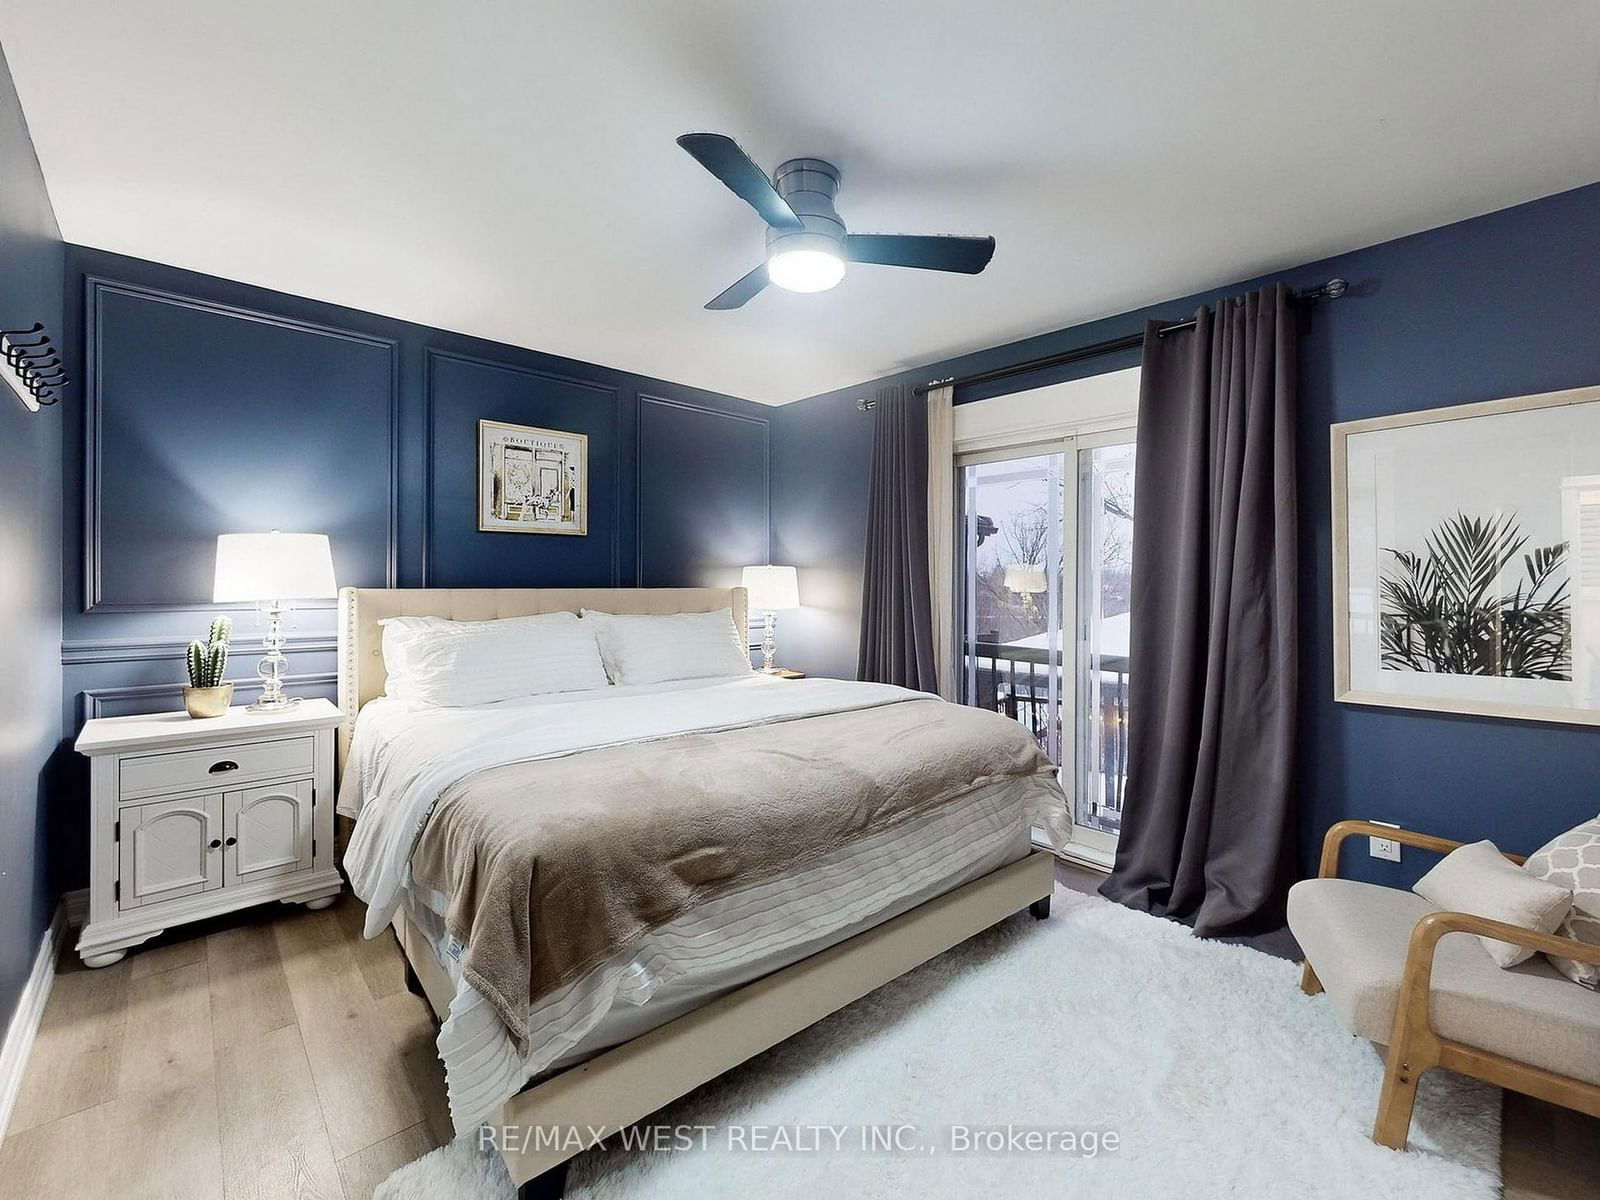
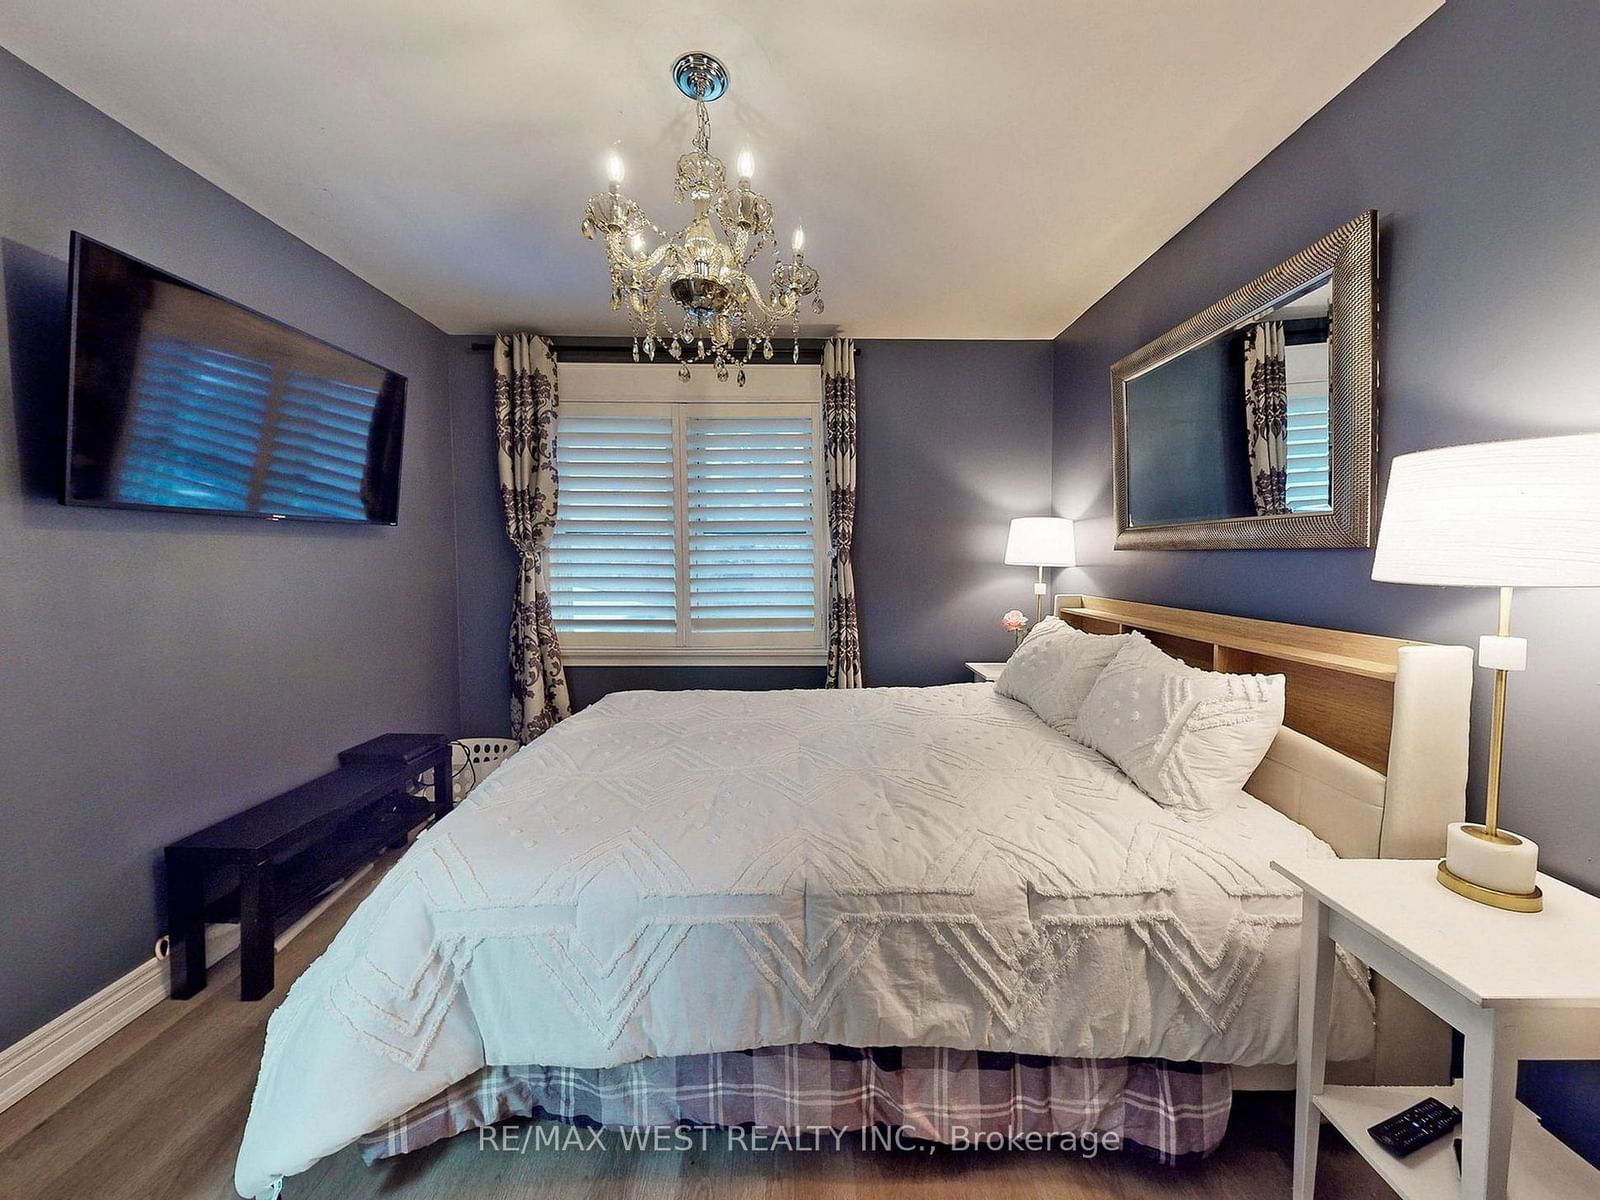
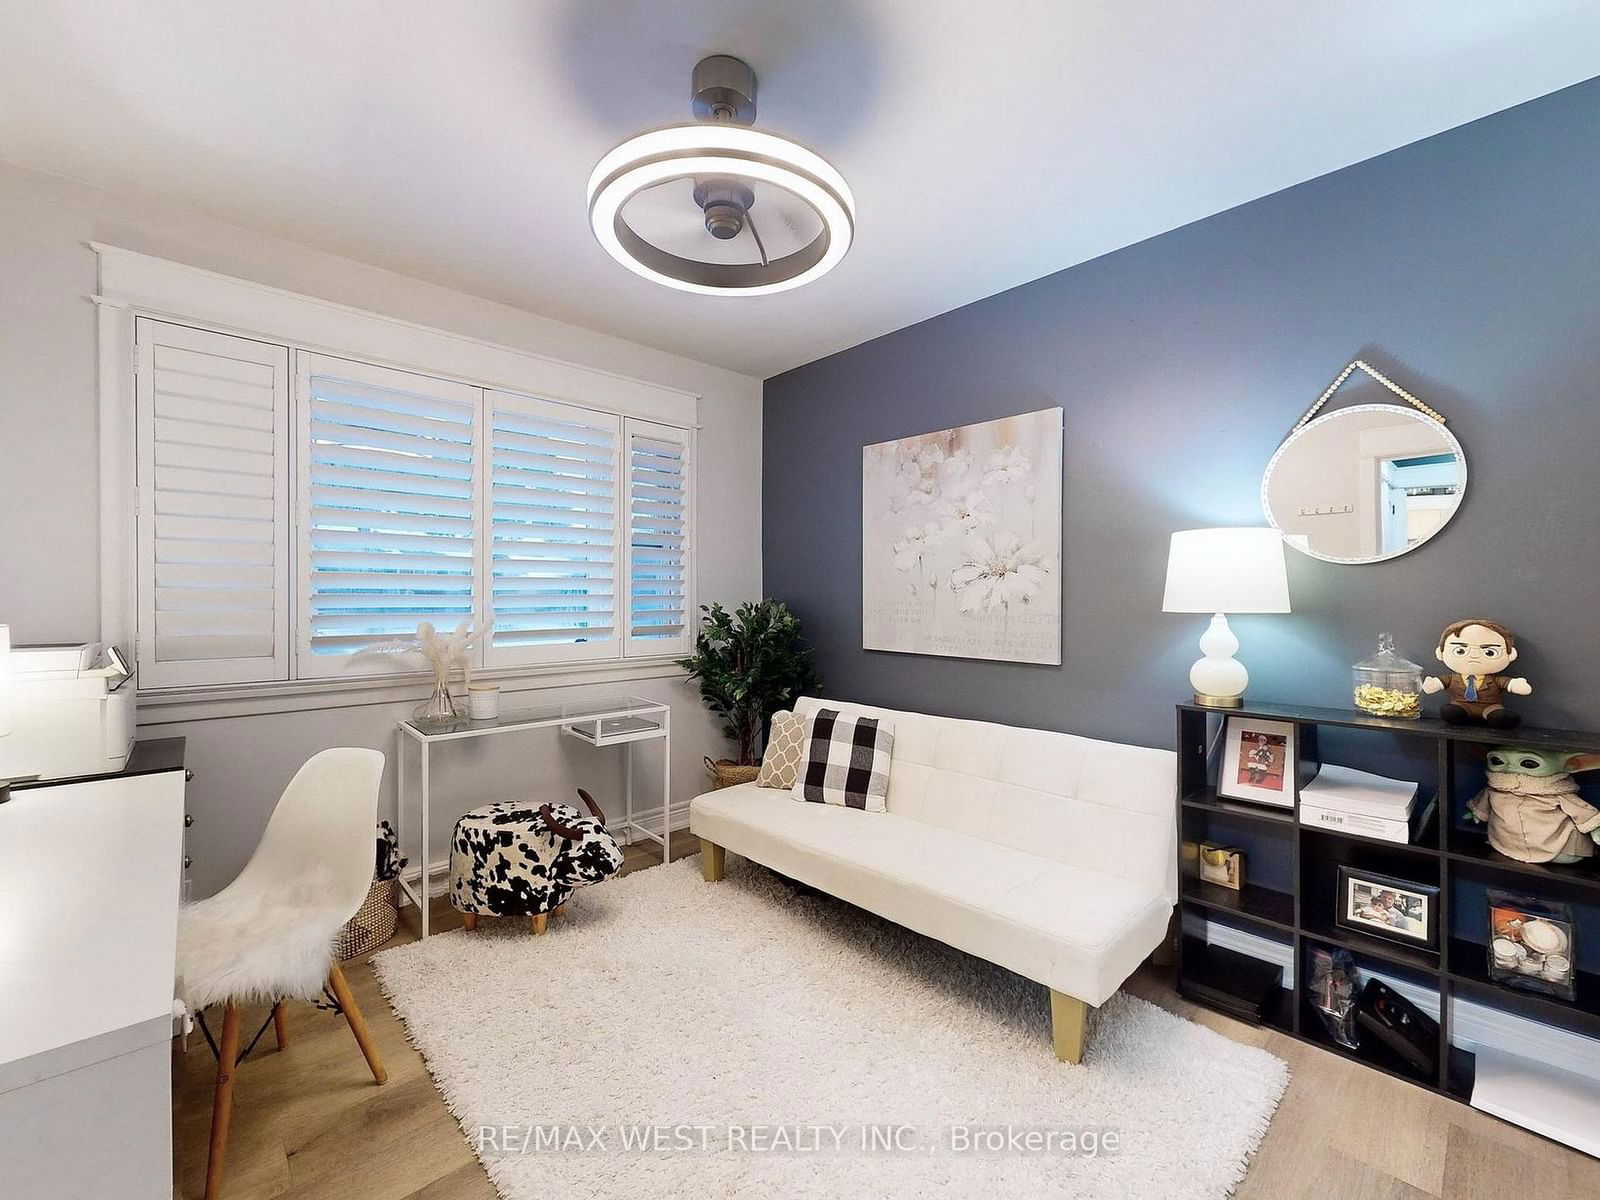
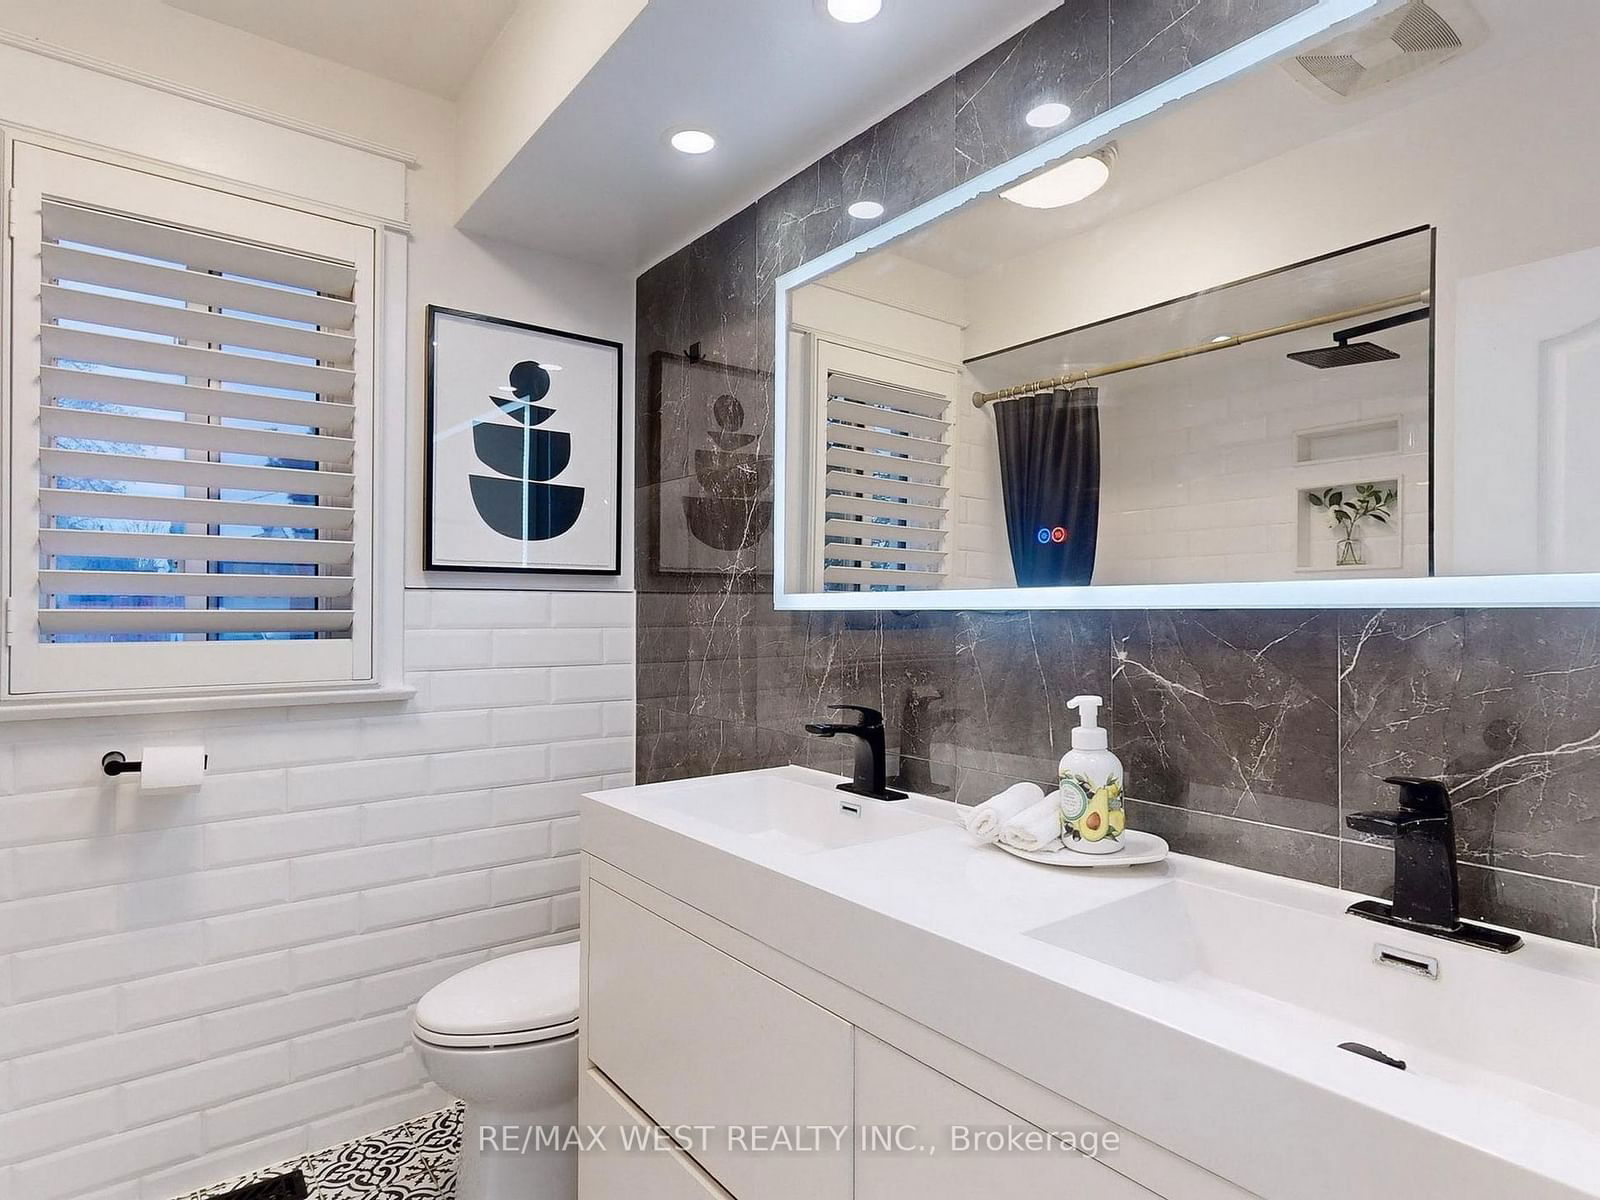
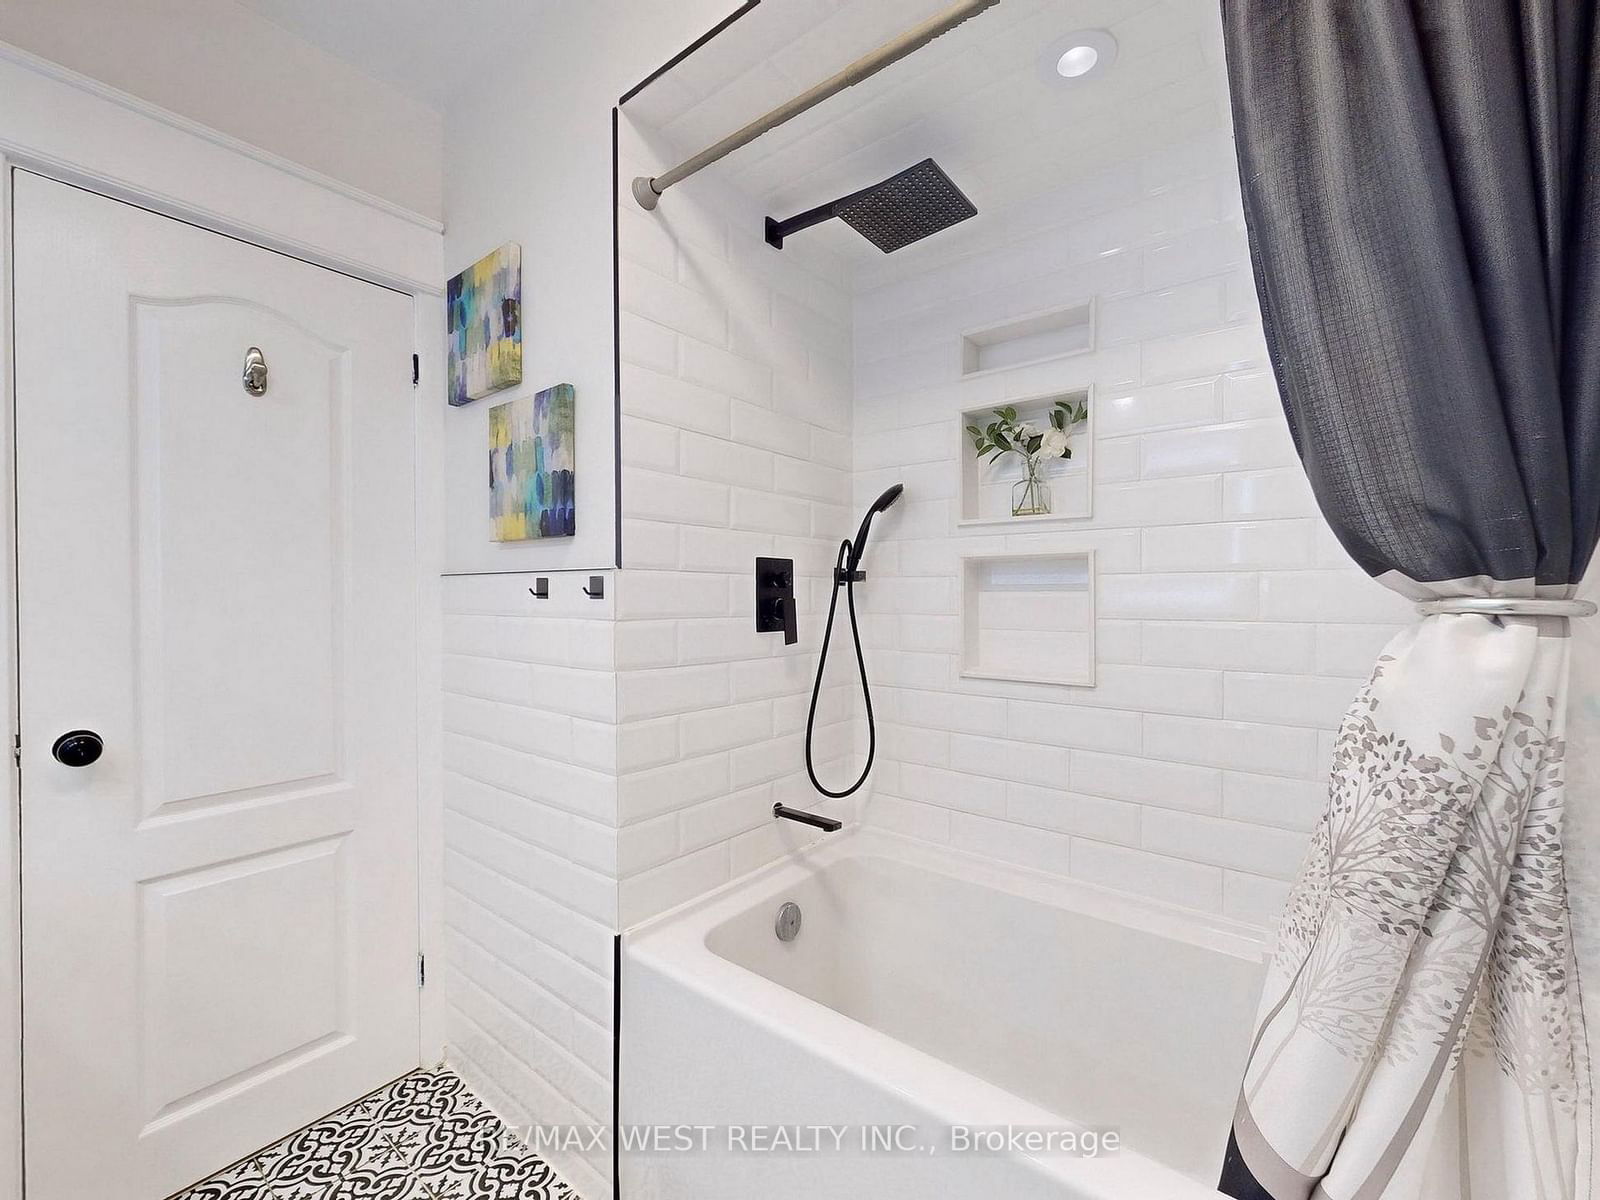
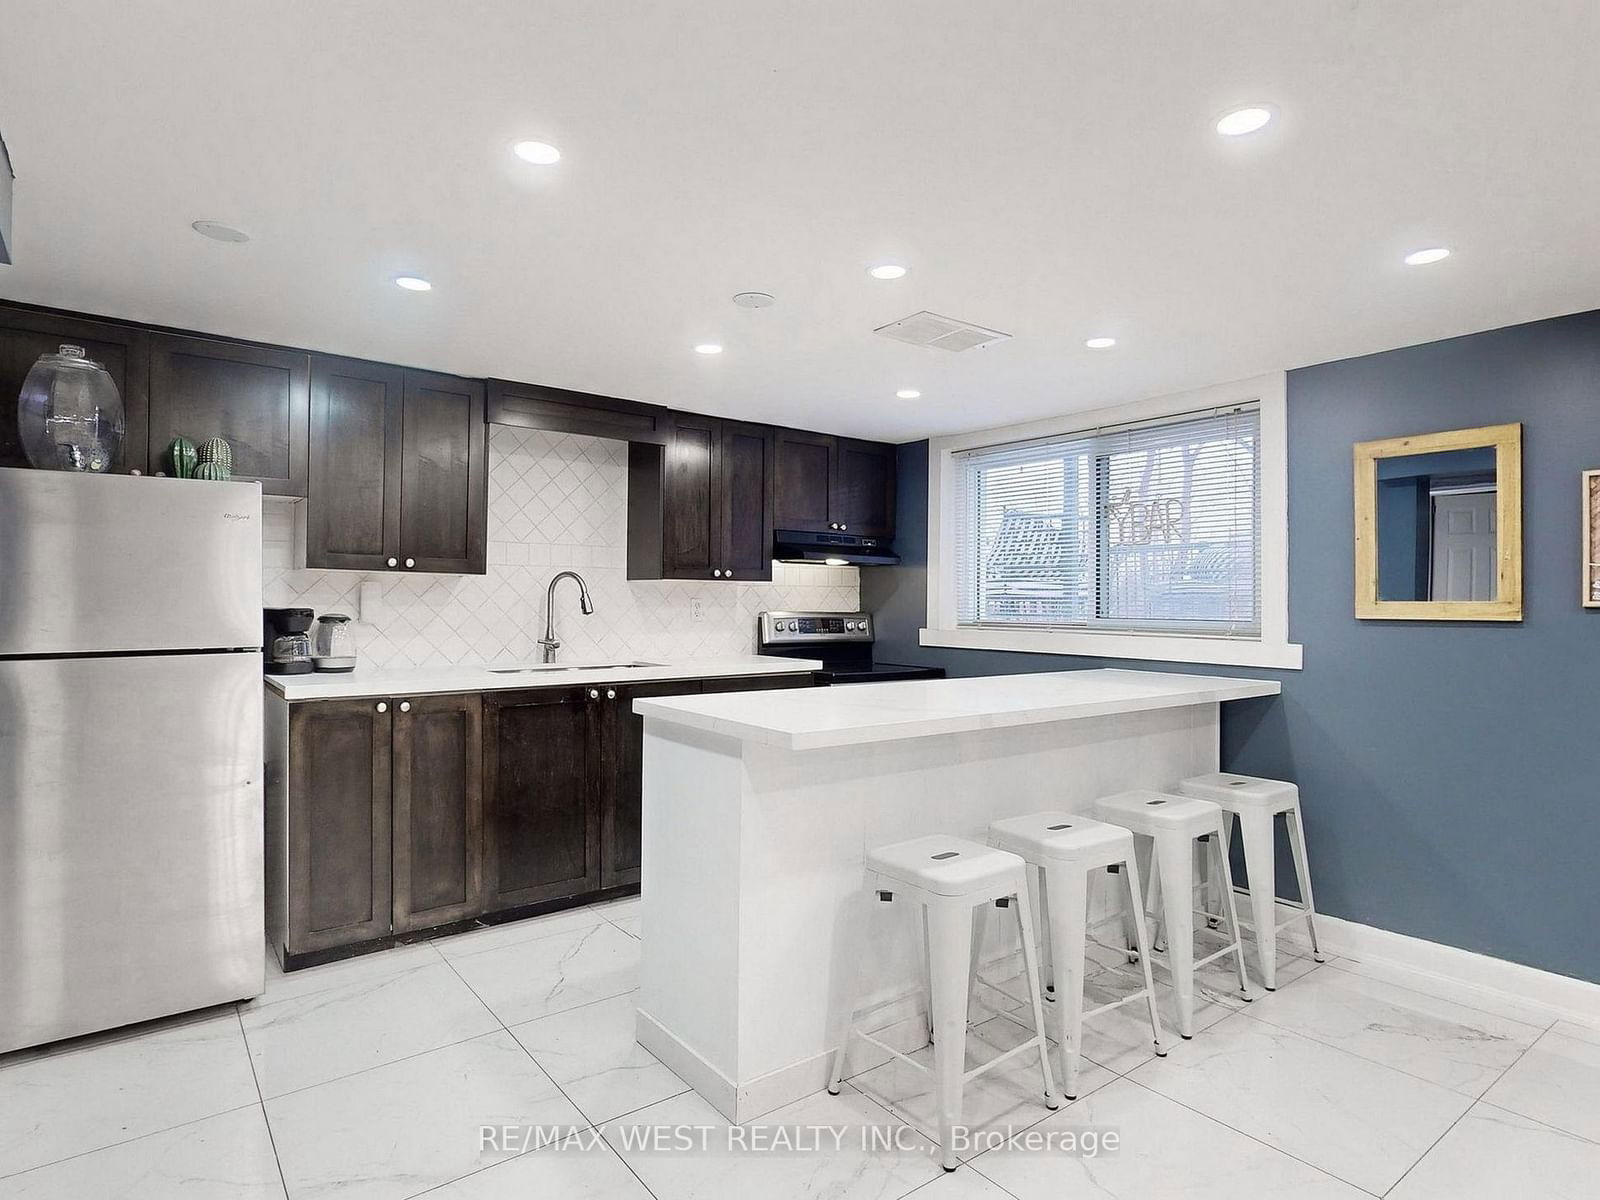
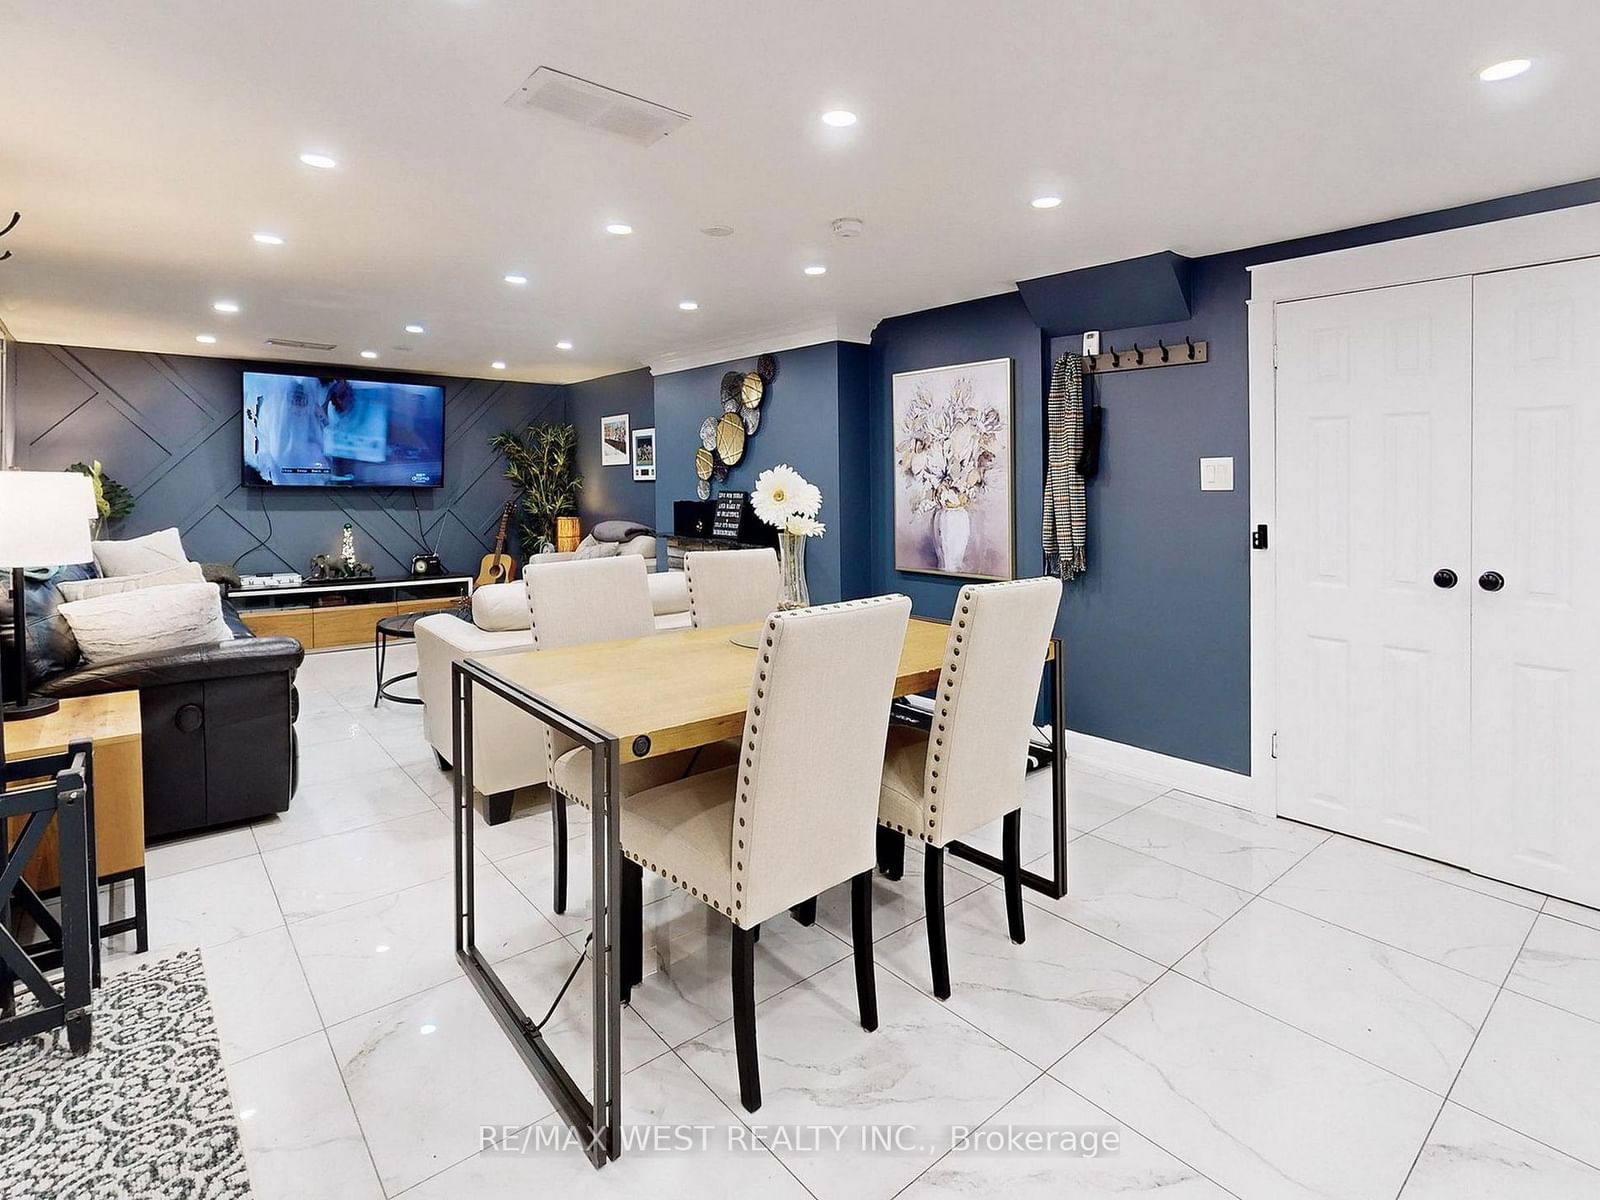
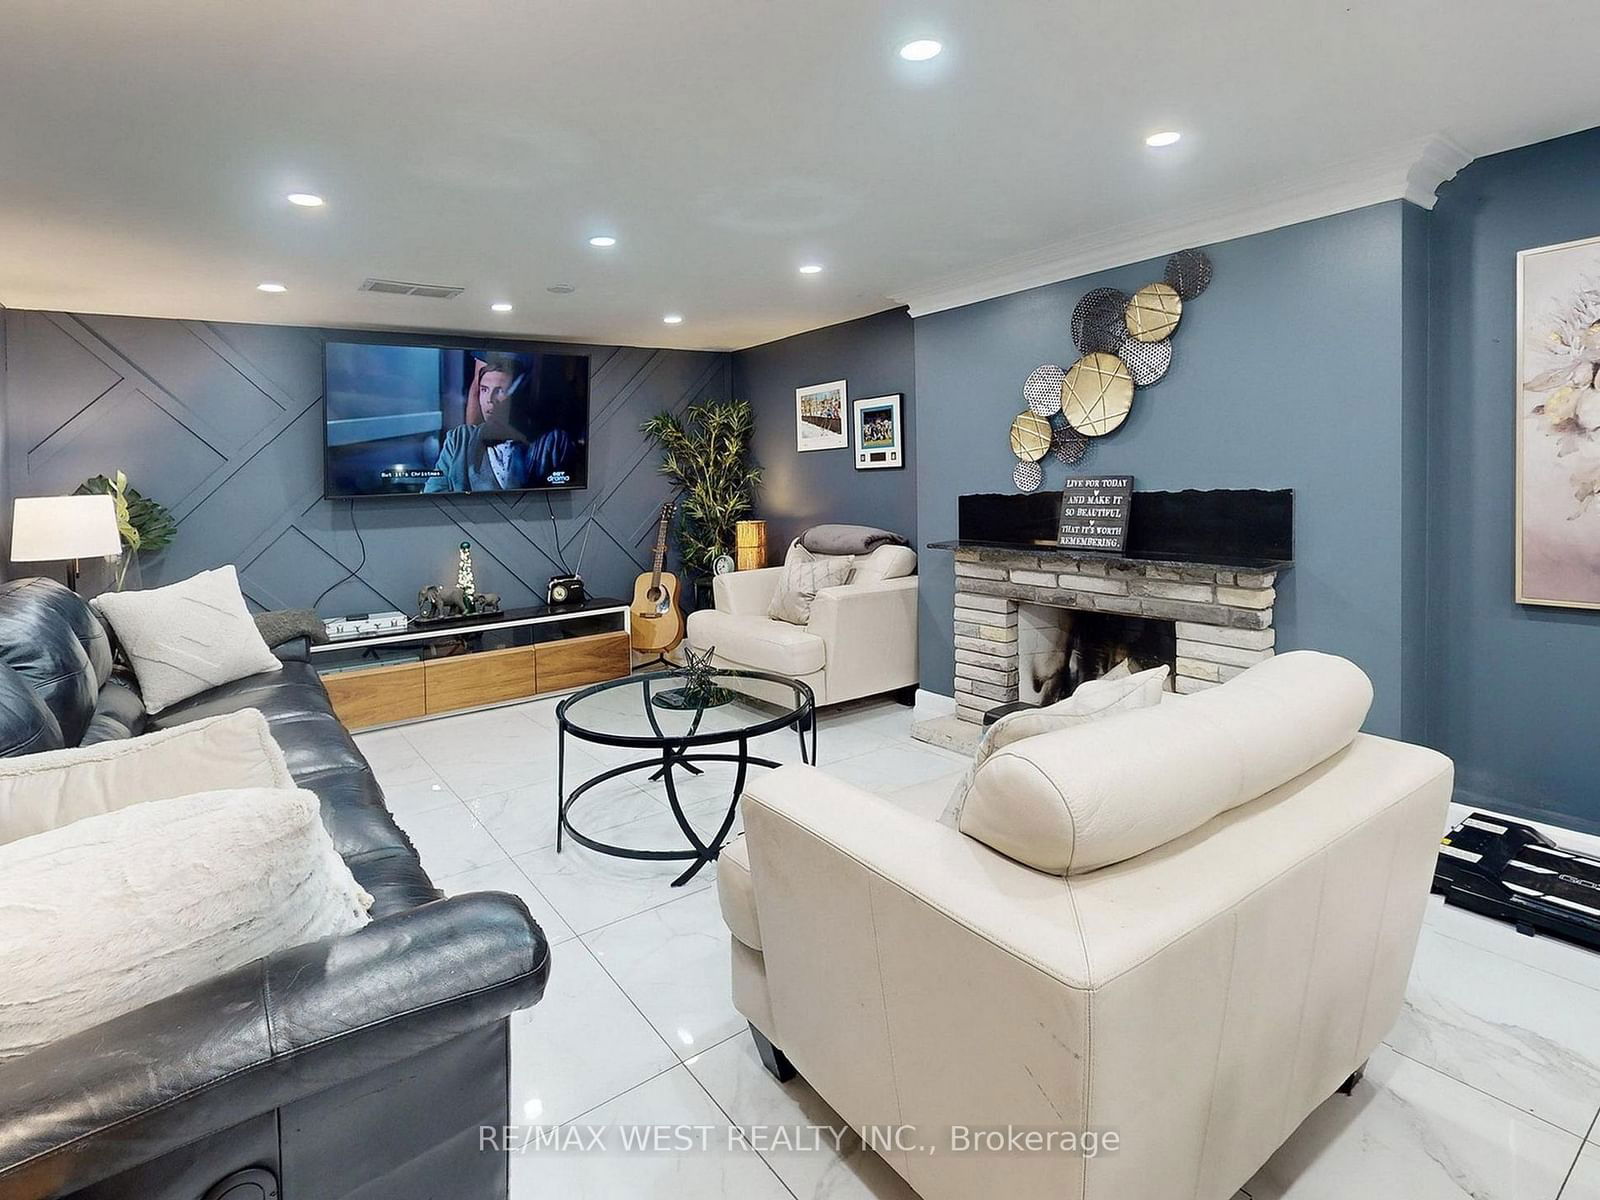
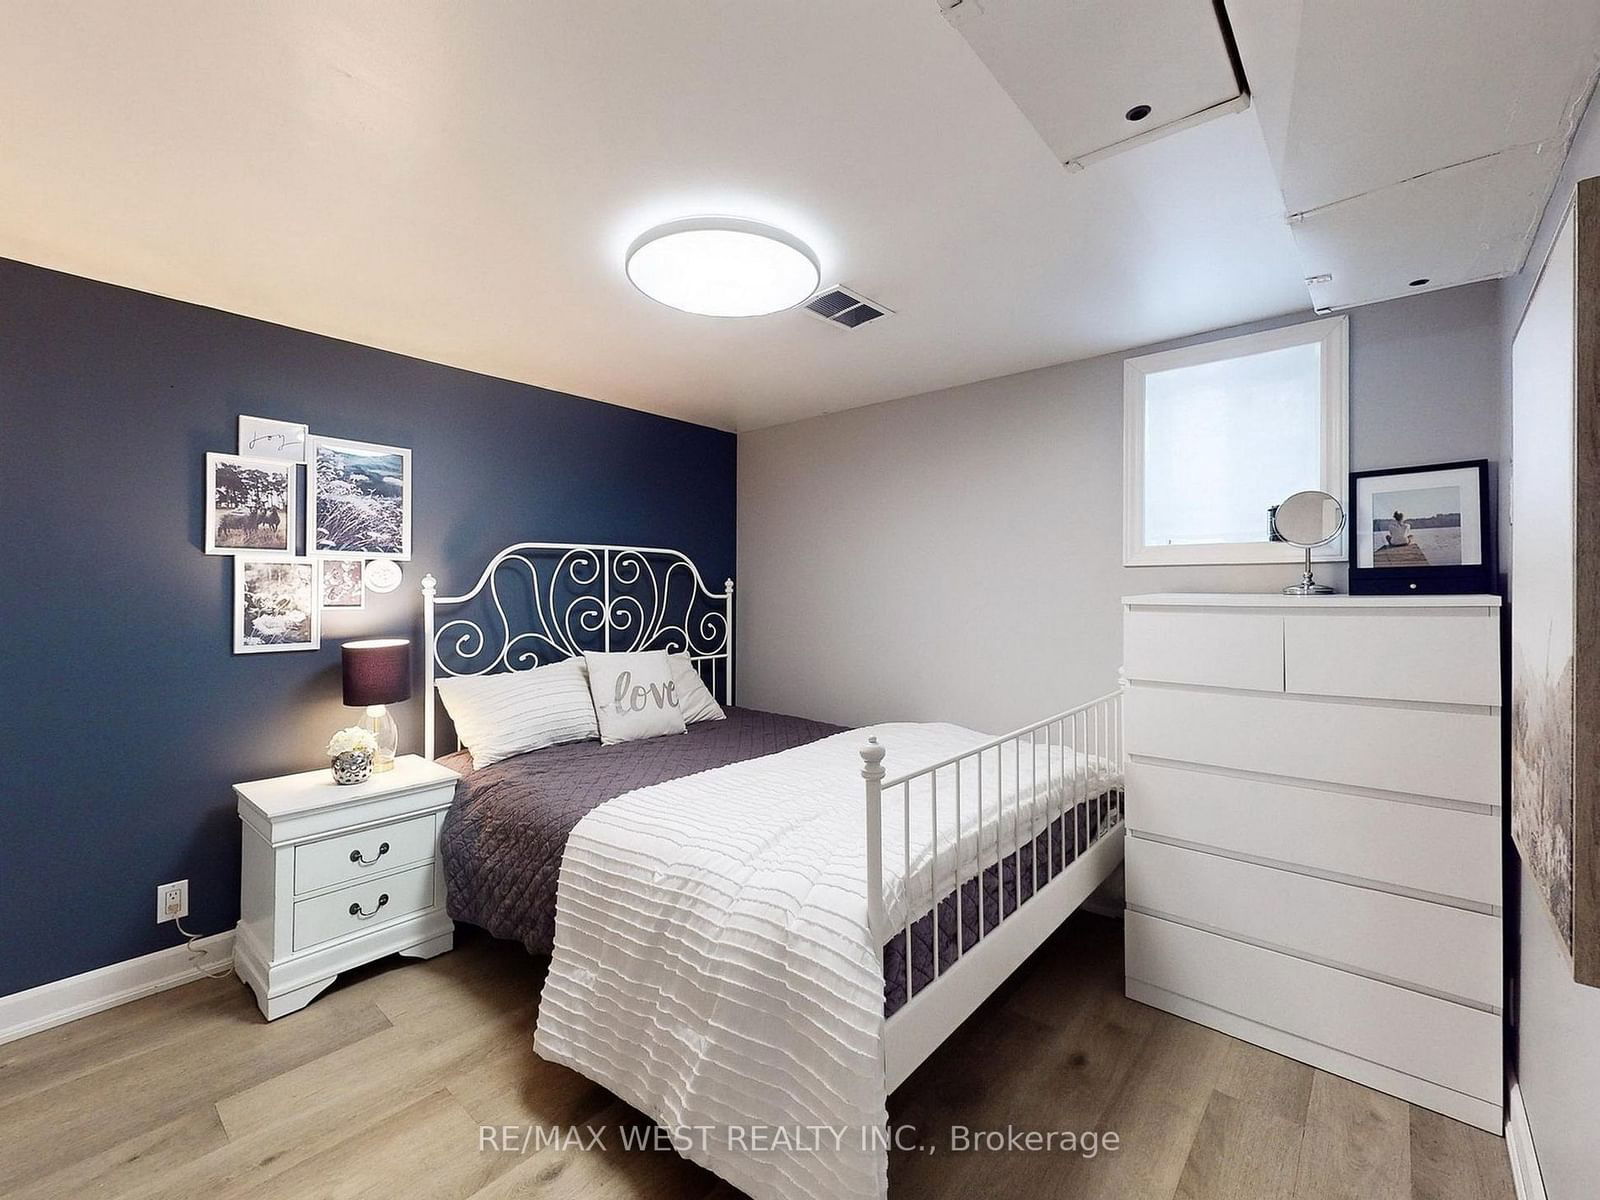
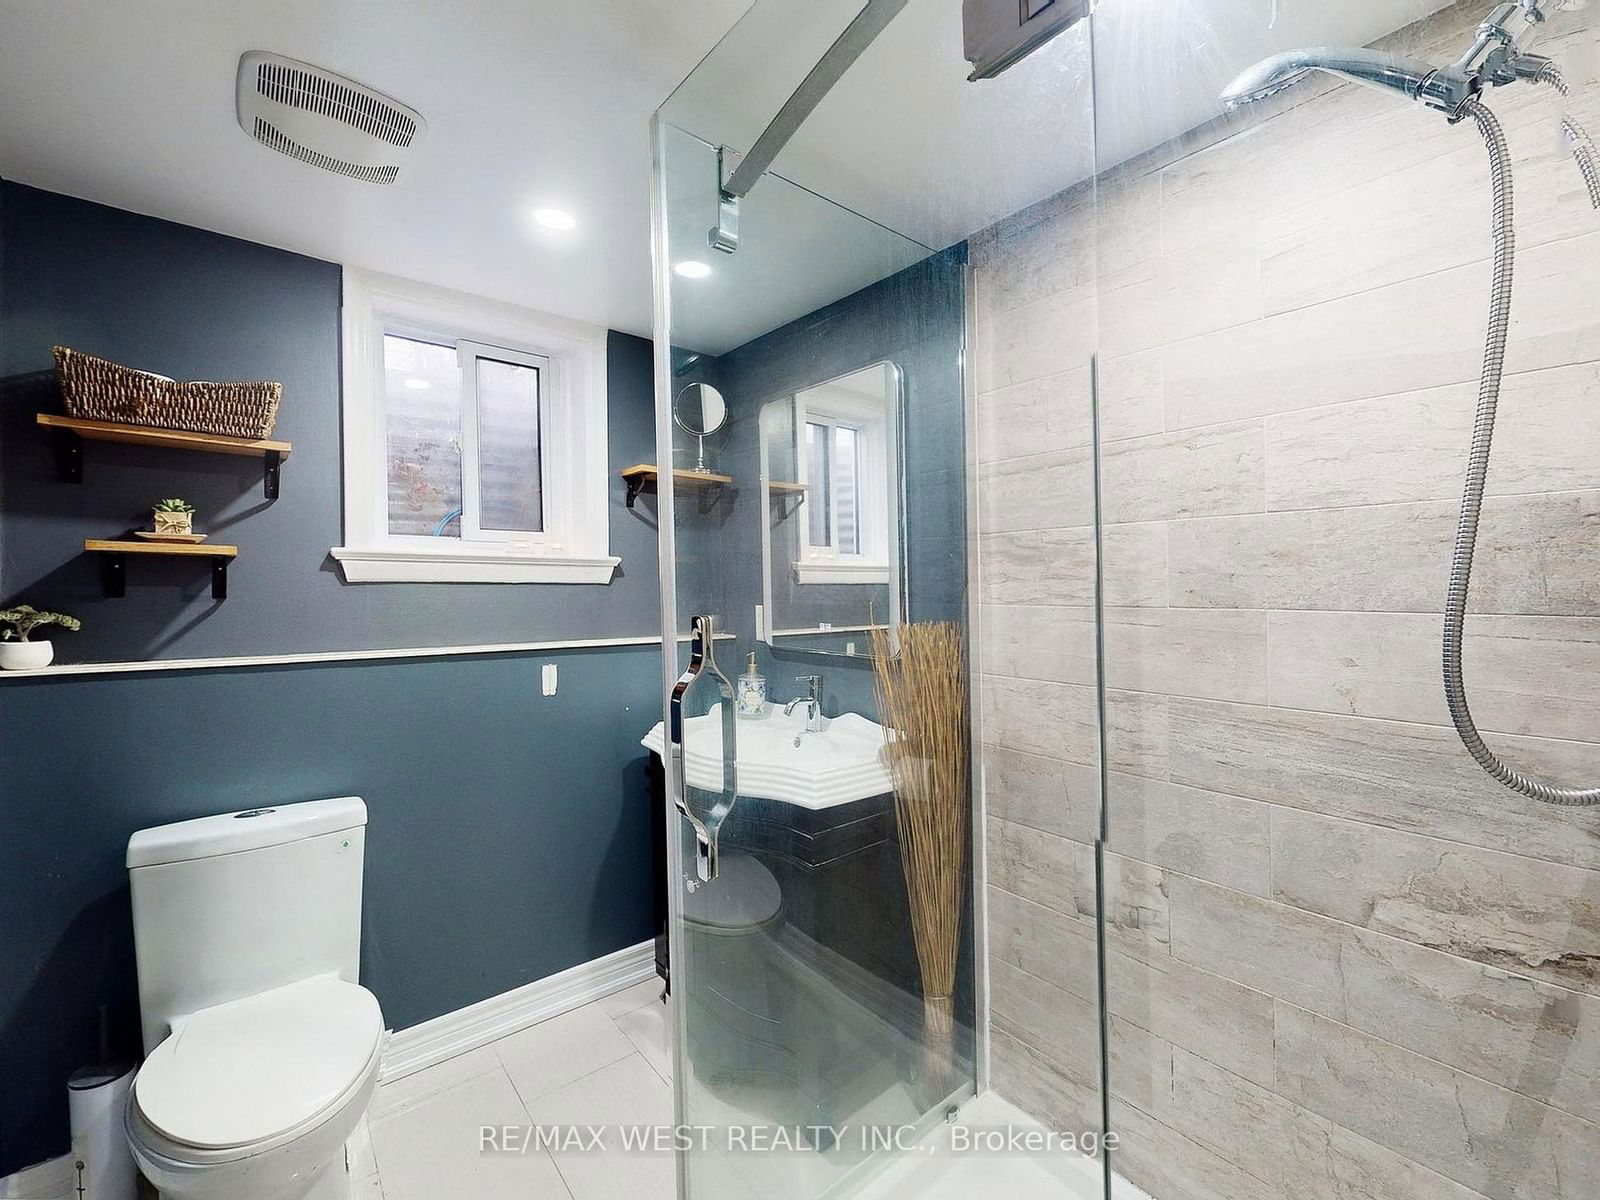
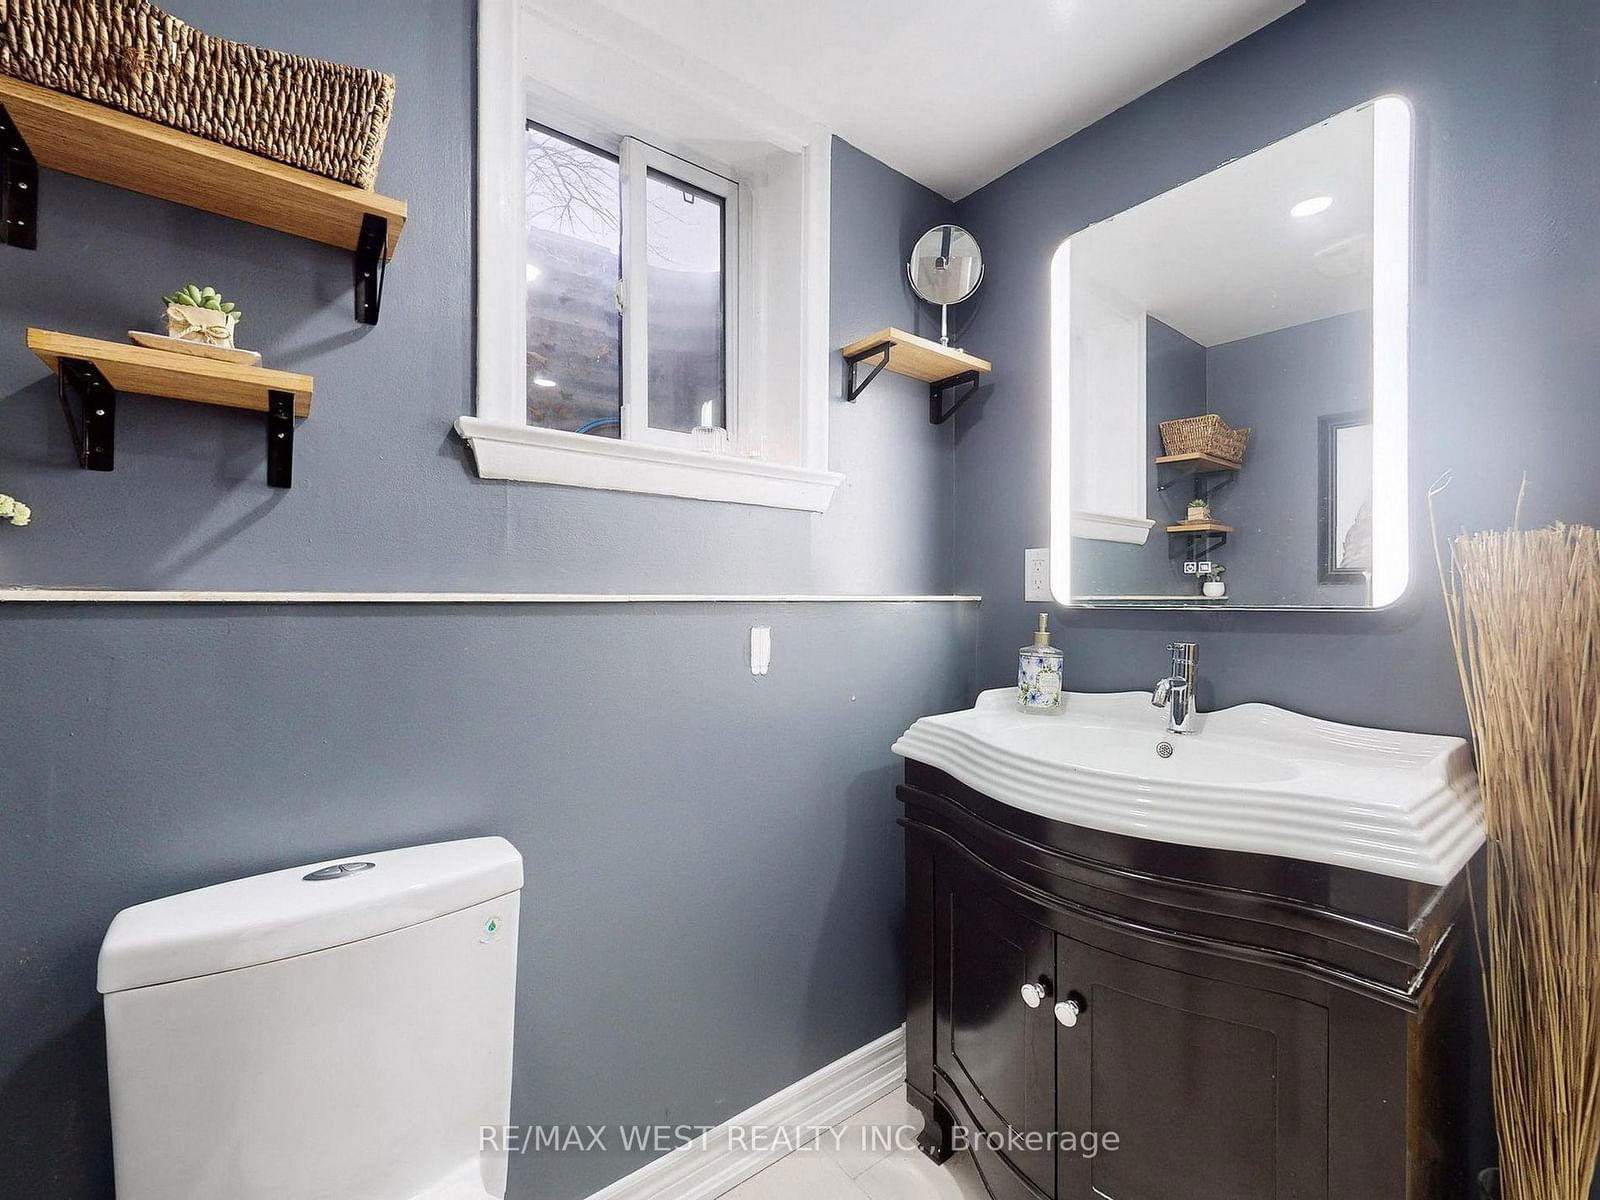
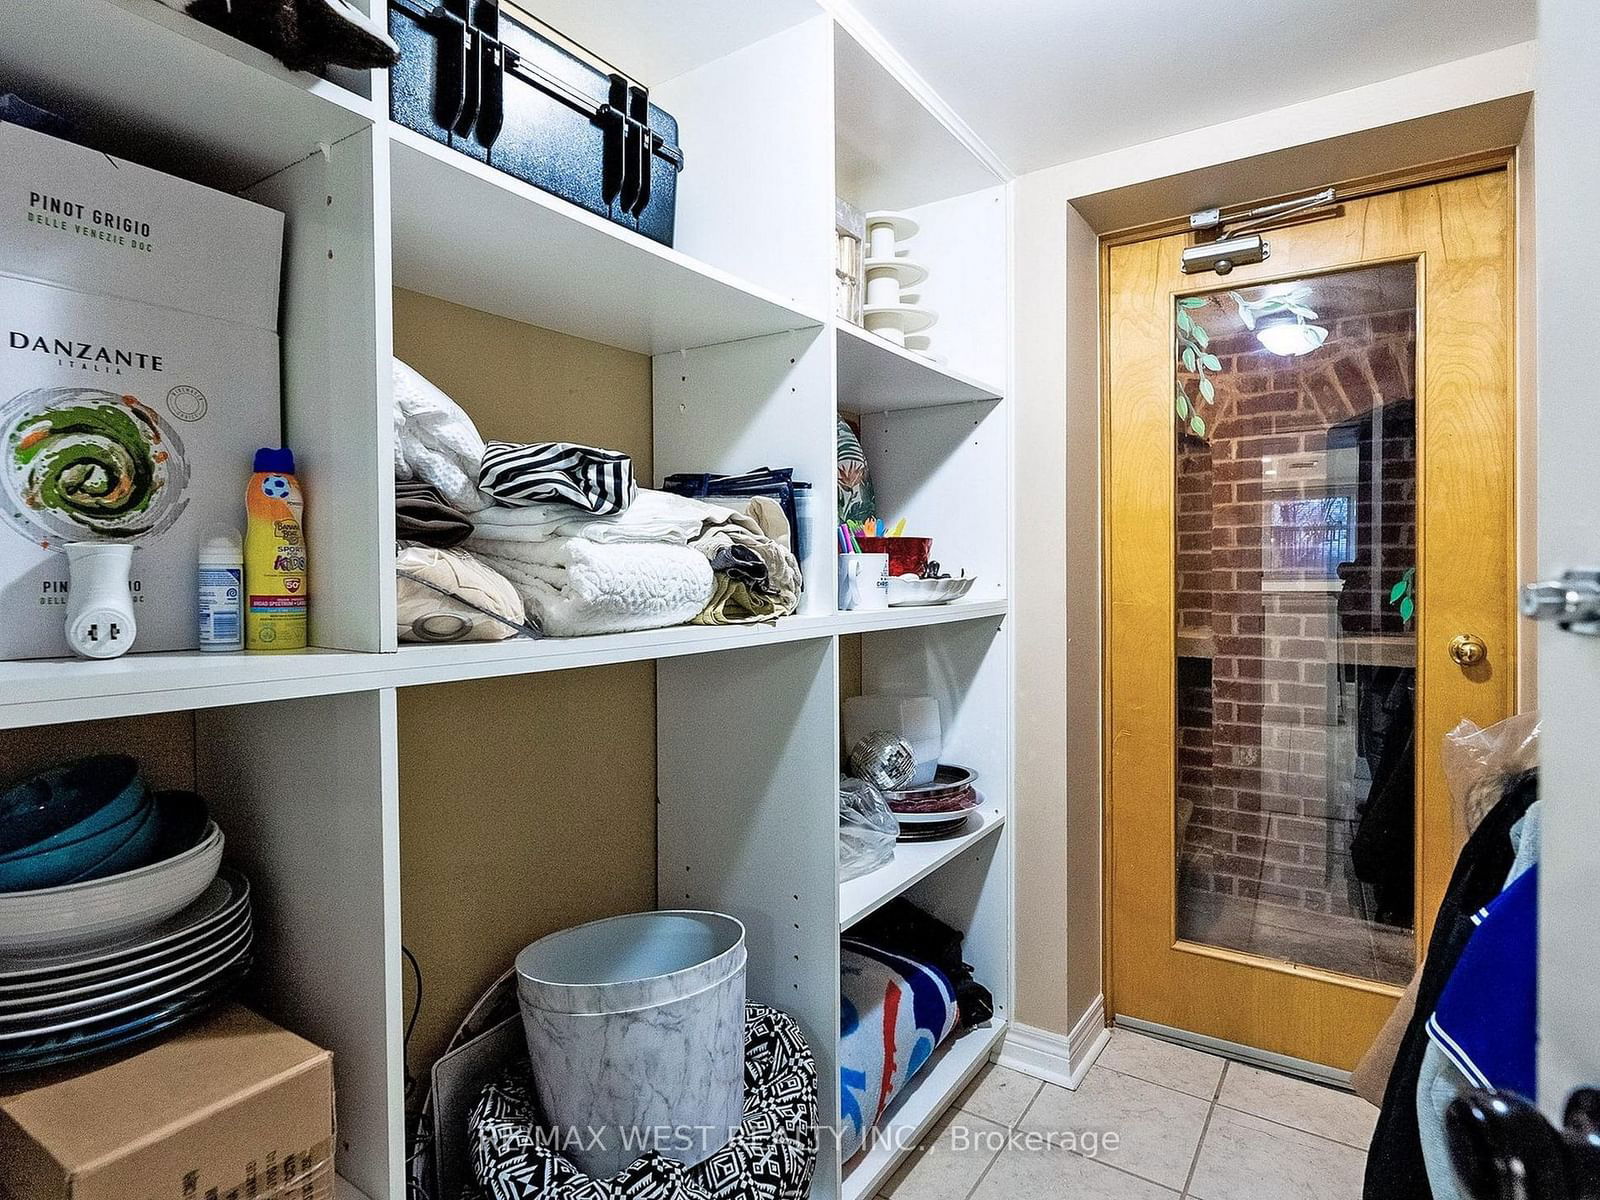
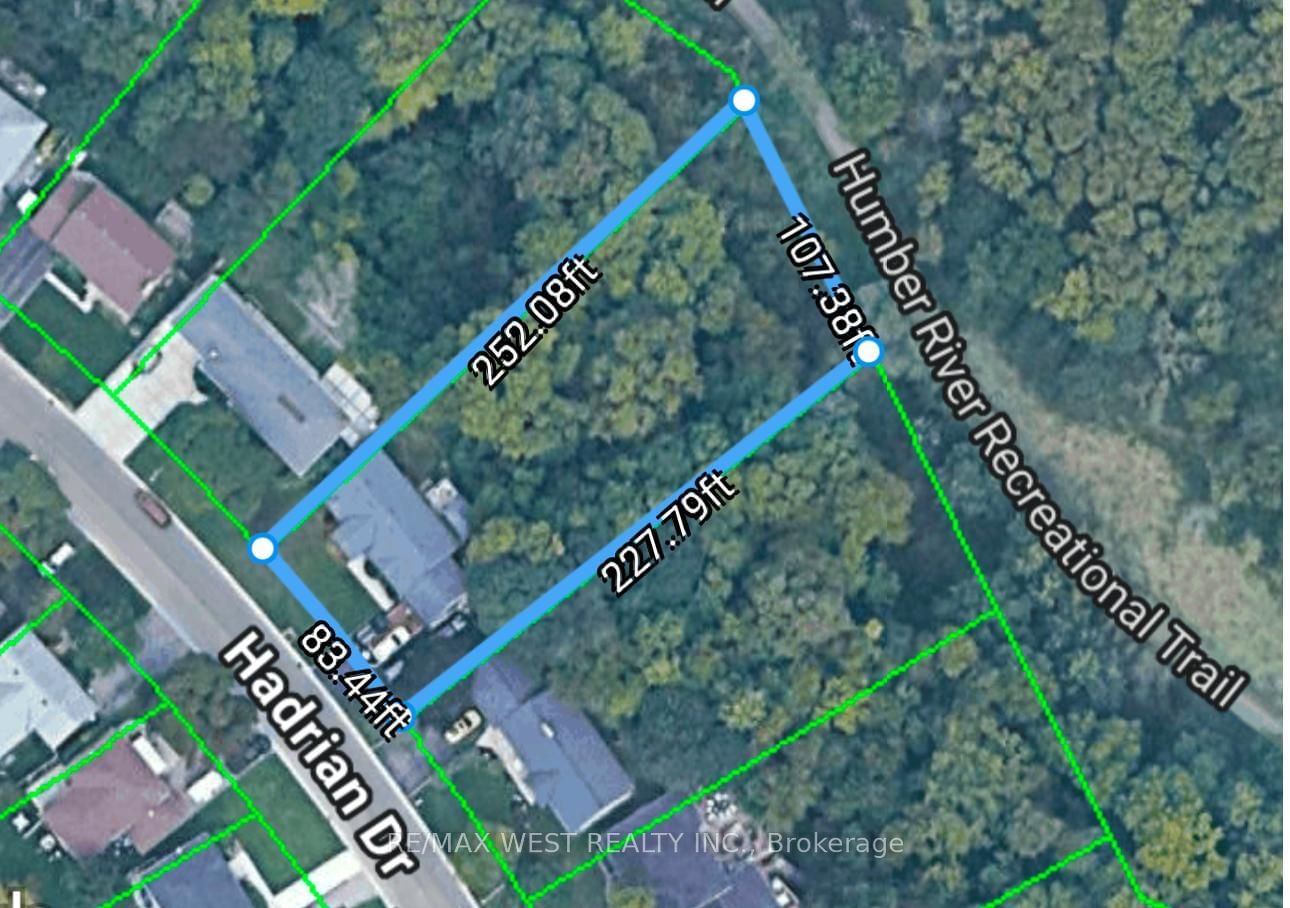
Desired Ranch Bungalow on 83 foot frontage; Beautiful home on East Side of Islington & 401, Beautifully renovated home with walkout finished basement in-law suite & separate entrance; flat ceilings throughout, large chef's style kitchen with centre island, LED lights throughout, newer bathrooms, newer bsmt.renovation, near the end of Hadrian Drive close to large park with trails & riverwalk to Pine Point Park & Arena, with Pool & Tennis Courts & huge soccer field, & toboggan hills, trails; close to many shops and new developments, Costco, Canadian Tire, Kung Fu Bubble Tea, Fresh Value Chinese Market, Walmart, Dollarama & many other shops. If you want to live in the T.O. but want to be away from the noise, this is the place. Close proximity to Yorkdale Mall (14 min), Islington Bus & Subway Stn, Hwy 400, Hwy 401, Hwy 427, Vaughan, Mississauga, You're really in the Centre of everything. **EXTRAS** 2 fridges, 1 gas range, 1 double oven stove, dishwasher, washer, dryer, ELFs, newer Napoleon fireplace, permanent outdoor hardtop gazebo; tv in kitchen, new A/c to be installed, new furnace to be installed, 3 new sliding doors to be installed, newer roof shingles (2020), newer windows (2020), newer 200 amp & ESA Certificate (2022); gutters cleaned (2024), hardwood floors still under vinyl, living room & dining room have upgraded wood-look tile flooring; Over 350k upgrades from 2010 to date.
- new A/c to be installed, new furnace to be installed, 3 new sliding doors in L-room to be installed (date of installation TBD); oprofessional home inspection report available.
Living
Dining
Kitchen
Breakfast
Foyer
Primary
2nd Br
3rd Br
Living
Kitchen
4th Br
5th Br
The graph below compares the average list price and average sale price of homes in this neighborhood by month for the last 24 months. When average sale price is greater than average list price, this may suggest a buyer's market. When average sale price is lower than the average list price this may suggest a seller's market.
The graph below illustrates the average days on market for homes in this neighborhood. The yellow area may indicate a buyer's market, the green area may indicate a balanced market and the red area may indicate a seller's market.
Sales Representative, Century 21 People’s Choice Realty Inc., Brokerage
(647) 576 - 2100
Toronto, Thistletown-Beaumonde Heights, M9V 1J3